An SQL case study
Load in required packages
Read in data
sales<-readr::read_csv("sales.csv")What variables do we have
names(sales)[1] "Order ID" "Product" "Quantity Ordered" "Price Each"
[5] "Order Date" "Purchase Address"look at the data types
sapply(sales[1,],class) Order ID Product Quantity Ordered Price Each
"character" "character" "character" "character"
Order Date Purchase Address
"character" "character" look at missing data
whats wrong with the data
try to find out where the missing values are coming from , will check the row numbers with missing values.
(to_run<-sales |>
  mutate(id=row_number()) |>
  relocate(id) |>
  filter(is.na(`Price Each`)))
# A tibble: 545 × 7
id `Order ID` Product `Quantity Ordered` `Price Each` `Order Date`
<int> <chr> <chr> <chr> <chr> <chr>
1 265 <NA> <NA> <NA> <NA> <NA>
2 649 <NA> <NA> <NA> <NA> <NA>
3 681 <NA> <NA> <NA> <NA> <NA>
4 1386 <NA> <NA> <NA> <NA> <NA>
5 1496 <NA> <NA> <NA> <NA> <NA>
6 2130 <NA> <NA> <NA> <NA> <NA>
7 2221 <NA> <NA> <NA> <NA> <NA>
8 3045 <NA> <NA> <NA> <NA> <NA>
9 3243 <NA> <NA> <NA> <NA> <NA>
10 3374 <NA> <NA> <NA> <NA> <NA>
# ℹ 535 more rows
# ℹ 1 more variable: `Purchase Address` <chr>now that we have seen that the columns are missing on common rows ,we can now remove all these!
Glimpse at the data
glimpse(sales)Rows: 186,305
Columns: 6
$ `Order ID` <chr> "295665", "295666", "295667", "295668", "295669", "…
$ Product <chr> "Macbook Pro Laptop", "LG Washing Machine", "USB-C …
$ `Quantity Ordered` <chr> "1", "1", "1", "1", "1", "1", "1", "2", "1", "4", "…
$ `Price Each` <chr> "1700", "600.0", "11.95", "149.99", "11.95", "3.84"…
$ `Order Date` <chr> "12/30/19 00:01", "12/29/19 07:03", "12/12/19 18:21…
$ `Purchase Address` <chr> "136 Church St, New York City, NY 10001", "562 2nd …why are price each and order quantity variables characters?
why is price each a character?…from the output of glimpse what can we see?
Looks like there has been some typo in the data as all the column observations contain the column name so let us drop these rows and rename certain columns
do we have any duplicates?
dim(sales)[1] 185950 6we have 186305 rows in our data
sales |>
  summarise(unique_rows=n_distinct(`Order ID`))
# A tibble: 1 × 1
unique_rows
<int>
1 178437but we have 178438 unique rows … this is because one person could order different products
# A tibble: 9 × 3
  quantity      n percent
  <chr>     <int>   <dbl>
1 1        168552  0.906
2 2         13324  0.0717
3 3          2920  0.0157
4 4           806  0.0043
5 5           236  0.0013
6 6            80  0.0004
7 7            24  0.0001
8 8             5  0
9 9 3 0 - well,people have a tendency of ordering what`s enough for them so its not surprising that most people would order one thing
look at class again
sapply(sales[1,],class) Order ID Product quantity Price Order Date address
"character" "character" "character" "character" "character" "character" Extracting more information from the data
let’s begin off by using R to achieve this and then later on use SQL for this!
lets look at address column
sales |>
  relocate(address)
# A tibble: 185,950 × 6
address `Order ID` Product quantity Price `Order Date`
<chr> <chr> <chr> <chr> <chr> <chr>
1 136 Church St, New York City,… 295665 Macboo… 1 1700 12/30/19 00…
2 562 2nd St, New York City, NY… 295666 LG Was… 1 600.0 12/29/19 07…
3 277 Main St, New York City, N… 295667 USB-C … 1 11.95 12/12/19 18…
4 410 6th St, San Francisco, CA… 295668 27in F… 1 149.… 12/22/19 15…
5 43 Hill St, Atlanta, GA 30301 295669 USB-C … 1 11.95 12/18/19 12…
6 200 Jefferson St, New York Ci… 295670 AA Bat… 1 3.84 12/31/19 22…
7 928 12th St, Portland, OR 970… 295671 USB-C … 1 11.95 12/16/19 15…
8 813 Hickory St, Dallas, TX 75… 295672 USB-C … 2 11.95 12/13/19 09…
9 718 Wilson St, Dallas, TX 750… 295673 Bose S… 1 99.99 12/15/19 23…
10 77 7th St, Dallas, TX 75001 295674 AAA Ba… 4 2.99 12/28/19 11…
# ℹ 185,940 more rowsone should note that this column contains useful information such as the street , city and zip . we need to extract the city and create a column for this!
- we can use the function
separate()to achieve this!
(sales_df<-sales |>
  separate(address,into=c("address1","city","code"),",") |>
  mutate_at(c(3,4),as.numeric) |>
  mutate_if(is.character,as.factor) |>
  relocate(c("address1","city","code")))
# A tibble: 185,950 × 8
address1 city code `Order ID` Product quantity Price `Order Date`
<fct> <fct> <fct> <fct> <fct> <dbl> <dbl> <fct>
1 136 Church St " New… " NY… 295665 Macboo… 1 1.7 e3 12/30/19 00…
2 562 2nd St " New… " NY… 295666 LG Was… 1 6 e2 12/29/19 07…
3 277 Main St " New… " NY… 295667 USB-C … 1 1.20e1 12/12/19 18…
4 410 6th St " San… " CA… 295668 27in F… 1 1.50e2 12/22/19 15…
5 43 Hill St " Atl… " GA… 295669 USB-C … 1 1.20e1 12/18/19 12…
6 200 Jefferson St " New… " NY… 295670 AA Bat… 1 3.84e0 12/31/19 22…
7 928 12th St " Por… " OR… 295671 USB-C … 1 1.20e1 12/16/19 15…
8 813 Hickory St " Dal… " TX… 295672 USB-C … 2 1.20e1 12/13/19 09…
9 718 Wilson St " Dal… " TX… 295673 Bose S… 1 1.00e2 12/15/19 23…
10 77 7th St " Dal… " TX… 295674 AAA Ba… 4 2.99e0 12/28/19 11…
# ℹ 185,940 more rowsnice , now we have the variable city standing on its own!
- now I can store this as a database! for comparisons sake
Storing as database
sales_df |>
  summarise(n_unique=n_distinct(city))
# A tibble: 1 × 1
n_unique
<int>
1 9SELECT COUNT(DISTINCT city) AS n_unique
FROM sales_df;| n_unique |
|---|
| 9 |
SELECT DISTINCT city AS n_unique
FROM sales_df;| n_unique |
|---|
| New York City |
| San Francisco |
| Atlanta |
| Portland |
| Dallas |
| Los Angeles |
| Boston |
| Austin |
| Seattle |
sales_df |>
  group_by(city) |>
  dplyr::summarise(sum_quantity=sum(quantity,na.rm=T)) |>
  arrange(desc(sum_quantity))
# A tibble: 9 × 2
city sum_quantity
<fct> <dbl>
1 " San Francisco" 50239
2 " Los Angeles" 33289
3 " New York City" 27932
4 " Boston" 22528
5 " Dallas" 16730
6 " Atlanta" 16602
7 " Seattle" 16553
8 " Portland" 14053
9 " Austin" 11153San Francisco had the most number of quantities sold as compared to other cities.
SELECT city ,SUM(quantity) AS sum_quantity
FROM sales_df
GROUP BY city
ORDER BY sum_quantity DESC;| city | sum_quantity |
|---|---|
| San Francisco | 50239 |
| Los Angeles | 33289 |
| New York City | 27932 |
| Boston | 22528 |
| Dallas | 16730 |
| Atlanta | 16602 |
| Seattle | 16553 |
| Portland | 14053 |
| Austin | 11153 |
sales_df |>
  group_by(city) |>
  dplyr::summarise(mean_sale=mean(Price,na.rm=T)) |>
  arrange(desc(mean_sale))
# A tibble: 9 × 2
city mean_sale
<fct> <dbl>
1 " Atlanta" 187.
2 " New York City" 186.
3 " Dallas" 186.
4 " Seattle" 186.
5 " Portland" 185.
6 " San Francisco" 184.
7 " Los Angeles" 183.
8 " Austin" 183.
9 " Boston" 182.Atlanta had the greatest average sales as compared to other cities.
SELECT city ,AVG(Price) AS mean_price
FROM sales_df
GROUP BY city
ORDER BY mean_price DESC;| city | mean_price |
|---|---|
| Atlanta | 186.8092 |
| New York City | 186.3391 |
| Dallas | 185.7374 |
| Seattle | 185.5346 |
| Portland | 185.1382 |
| San Francisco | 183.5702 |
| Los Angeles | 183.1257 |
| Austin | 182.7232 |
| Boston | 182.4726 |
sales_df |>
  group_by(Product) |>
  dplyr::summarise(num_quantity=sum(quantity,na.rm=T)) |>
  arrange(desc(num_quantity)) |>
  head(n=10)
# A tibble: 10 × 2
Product num_quantity
<fct> <dbl>
1 AAA Batteries (4-pack) 31017
2 AA Batteries (4-pack) 27635
3 USB-C Charging Cable 23975
4 Lightning Charging Cable 23217
5 Wired Headphones 20557
6 Apple Airpods Headphones 15661
7 Bose SoundSport Headphones 13457
8 27in FHD Monitor 7550
9 iPhone 6849
10 27in 4K Gaming Monitor 6244AAA Batteries (4-pack) had the most number of quantities sold
SELECT Product ,SUM(quantity) AS num_quantity
FROM sales_df
GROUP BY Product
ORDER BY num_quantity DESC
LIMIT 10;| Product | num_quantity |
|---|---|
| AAA Batteries (4-pack) | 31017 |
| AA Batteries (4-pack) | 27635 |
| USB-C Charging Cable | 23975 |
| Lightning Charging Cable | 23217 |
| Wired Headphones | 20557 |
| Apple Airpods Headphones | 15661 |
| Bose SoundSport Headphones | 13457 |
| 27in FHD Monitor | 7550 |
| iPhone | 6849 |
| 27in 4K Gaming Monitor | 6244 |
sales_df |>
  group_by(Product) |>
  dplyr::summarise(sum_price=sum(Price*quantity)) |>
  arrange(desc(sum_price)) |>
  head(n=10)
# A tibble: 10 × 2
Product sum_price
<fct> <dbl>
1 Macbook Pro Laptop 8037600
2 iPhone 4794300
3 ThinkPad Laptop 4129959.
4 Google Phone 3319200
5 27in 4K Gaming Monitor 2435098.
6 34in Ultrawide Monitor 2355558.
7 Apple Airpods Headphones 2349150
8 Flatscreen TV 1445700
9 Bose SoundSport Headphones 1345565.
10 27in FHD Monitor 1132424.SELECT Product ,SUM(Price*quantity) AS sum_price
FROM sales_df
GROUP BY Product
ORDER BY sum_price DESC
LIMIT 10;| Product | sum_price |
|---|---|
| Macbook Pro Laptop | 8037600 |
| iPhone | 4794300 |
| ThinkPad Laptop | 4129959 |
| Google Phone | 3319200 |
| 27in 4K Gaming Monitor | 2435098 |
| 34in Ultrawide Monitor | 2355558 |
| Apple Airpods Headphones | 2349150 |
| Flatscreen TV | 1445700 |
| Bose SoundSport Headphones | 1345565 |
| 27in FHD Monitor | 1132425 |
Aggregating by day and time only focusing on 2019
- lets look at the date column
sales_df |>
  relocate(`Order Date`)
# A tibble: 185,950 × 10
`Order Date` address1 city code `Order ID` Product quantity Price
<fct> <fct> <fct> <fct> <fct> <fct> <dbl> <dbl>
1 12/30/19 00:01 136 Church St " Ne… " NY… 295665 Macboo… 1 1.7 e3
2 12/29/19 07:03 562 2nd St " Ne… " NY… 295666 LG Was… 1 6 e2
3 12/12/19 18:21 277 Main St " Ne… " NY… 295667 USB-C … 1 1.20e1
4 12/22/19 15:13 410 6th St " Sa… " CA… 295668 27in F… 1 1.50e2
5 12/18/19 12:38 43 Hill St " At… " GA… 295669 USB-C … 1 1.20e1
6 12/31/19 22:58 200 Jefferson … " Ne… " NY… 295670 AA Bat… 1 3.84e0
7 12/16/19 15:10 928 12th St " Po… " OR… 295671 USB-C … 1 1.20e1
8 12/13/19 09:29 813 Hickory St " Da… " TX… 295672 USB-C … 2 1.20e1
9 12/15/19 23:26 718 Wilson St " Da… " TX… 295673 Bose S… 1 1.00e2
10 12/28/19 11:51 77 7th St " Da… " TX… 295674 AAA Ba… 4 2.99e0
# ℹ 185,940 more rows
# ℹ 2 more variables: Date <dttm>, Date1 <chr>the date column contains some wealth of information so we will extract year,month ,day and hour using lubridate package.
sales_df<-sales_df |>
  mutate(Date=mdy_hm(`Order Date`), # change to date
         year=year(Date),           # extract year
         Month=month(Date,label=T), # extract month
         Day=wday(Date,label=T),    # extract weekday
         hour=hour(Date),           # extract hour
         quarter=quarter(Date),     # extract quarter
         am_pm=pm(Date),            # extract day or evening
         Date1=as.character(Date))
sales_df
# A tibble: 185,950 × 16
address1 city code `Order ID` Product quantity Price `Order Date`
<fct> <fct> <fct> <fct> <fct> <dbl> <dbl> <fct>
1 136 Church St " New… " NY… 295665 Macboo… 1 1.7 e3 12/30/19 00…
2 562 2nd St " New… " NY… 295666 LG Was… 1 6 e2 12/29/19 07…
3 277 Main St " New… " NY… 295667 USB-C … 1 1.20e1 12/12/19 18…
4 410 6th St " San… " CA… 295668 27in F… 1 1.50e2 12/22/19 15…
5 43 Hill St " Atl… " GA… 295669 USB-C … 1 1.20e1 12/18/19 12…
6 200 Jefferson St " New… " NY… 295670 AA Bat… 1 3.84e0 12/31/19 22…
7 928 12th St " Por… " OR… 295671 USB-C … 1 1.20e1 12/16/19 15…
8 813 Hickory St " Dal… " TX… 295672 USB-C … 2 1.20e1 12/13/19 09…
9 718 Wilson St " Dal… " TX… 295673 Bose S… 1 1.00e2 12/15/19 23…
10 77 7th St " Dal… " TX… 295674 AAA Ba… 4 2.99e0 12/28/19 11…
# ℹ 185,940 more rows
# ℹ 8 more variables: Date <dttm>, Date1 <chr>, year <dbl>, Month <ord>,
# Day <ord>, hour <int>, quarter <int>, am_pm <lgl>sales_df |>
filter(year==2019) |>
group_by(Month) |>
dplyr::summarise(sum_price=sum(quantity*Price)) |>
arrange(desc(sum_price)) # A tibble: 12 × 2
Month sum_price
<ord> <dbl>
1 Dec 4613443.
2 Oct 3736727.
3 Apr 3390670.
4 Nov 3199603.
5 May 3152607.
6 Mar 2807100.
7 Jul 2647776.
8 Jun 2577802.
9 Aug 2244468.
10 Feb 2202022.
11 Sep 2097560.
12 Jan 1813586.On average , May had the greatest amount of sales
SELECT strftime('%m',Date1) AS month,
       strftime('%Y',Date1) AS year,
       SUM(quantity*Price) AS total_price
FROM sales_df
GROUP BY month
HAVING strftime('%Y',Date1) = '2019'
ORDER BY total_price DESC;
| month | year | total_price |
|---|---|---|
| 12 | 2019 | 4613443 |
| 10 | 2019 | 3736727 |
| 04 | 2019 | 3390670 |
| 11 | 2019 | 3199603 |
| 05 | 2019 | 3152607 |
| 03 | 2019 | 2807100 |
| 07 | 2019 | 2647776 |
| 06 | 2019 | 2577802 |
| 08 | 2019 | 2244468 |
| 02 | 2019 | 2202022 |
sales_df |>
  filter(year==2019) |>
  group_by(hour) |>
  dplyr::summarise(sum_price=sum(Price*quantity)) |>
  arrange(desc(sum_price))
# A tibble: 24 × 2
hour sum_price
<int> <dbl>
1 19 2412939.
2 12 2316821.
3 11 2300610.
4 20 2281716.
5 18 2219348.
6 13 2155390.
7 17 2129362.
8 14 2083673.
9 21 2042001.
10 10 1944287.
# ℹ 14 more rowswe have like 24 hours arranged in assending where 1-24 is increasing order of time from early moring to midnight
sales_df |>
  filter(year==2019) |>
  group_by(hour) |>
  dplyr::summarise(sum_price=sum(Price*quantity)) |>
  arrange(desc(sum_price)) |>
  ggplot(aes(x=hour,sum_price))+
  geom_point()+
  geom_line()+
  tvthemes::theme_simpsons()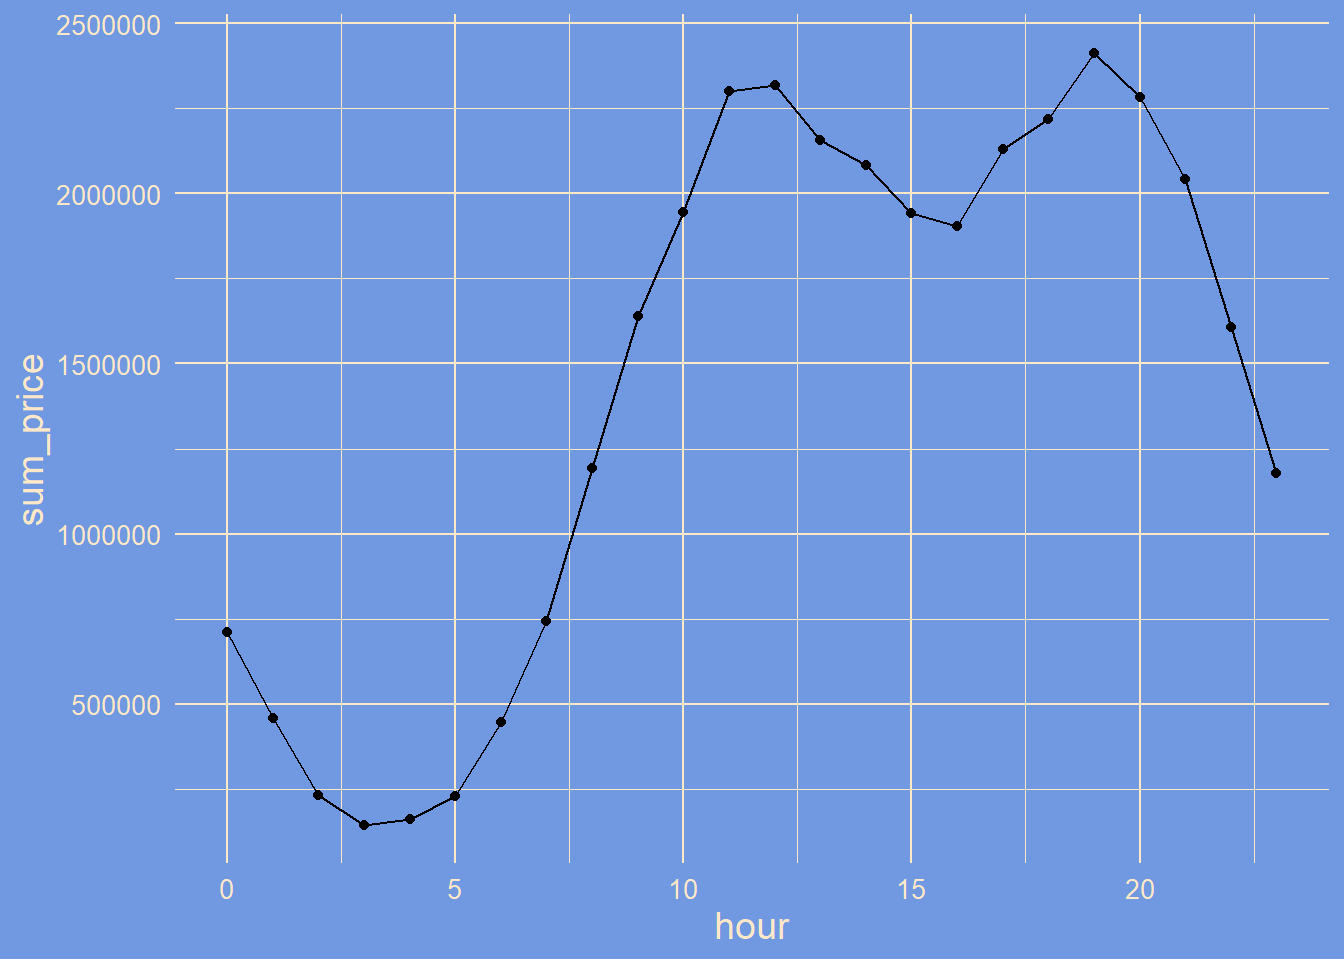
we notice a huge peek between 10am and 1pm then between 6pm and 8pm
SELECT strftime('%Y',Date1) AS year,
       strftime('%H',Date1) AS hour,
       SUM(quantity*Price) AS total_price
FROM sales_df
GROUP BY hour
HAVING strftime('%Y',Date1) = '2019'
ORDER BY total_price DESC;
| year | hour | total_price |
|---|---|---|
| 2019 | 19 | 2412939 |
| 2019 | 12 | 2316821 |
| 2019 | 11 | 2300610 |
| 2019 | 20 | 2281716 |
| 2019 | 18 | 2219348 |
| 2019 | 13 | 2155390 |
| 2019 | 17 | 2129362 |
| 2019 | 14 | 2083673 |
| 2019 | 21 | 2042001 |
| 2019 | 10 | 1944287 |