| TIME | Event | Gender | Smoking | Diabetes | BP | Anaemia | Age | Ejection.Fraction | Sodium | Creatinine | Pletelets | CPK |
|---|---|---|---|---|---|---|---|---|---|---|---|---|
| 97 | 0 | 0 | 0 | 0 | 0 | 1 | 43 | 50 | 135 | 1.30 | 237000 | 358 |
| 180 | 0 | 1 | 1 | 1 | 0 | 1 | 73 | 30 | 142 | 1.18 | 160000 | 231 |
| 31 | 1 | 1 | 1 | 0 | 1 | 0 | 70 | 20 | 134 | 1.83 | 263358 | 582 |
| 87 | 0 | 1 | 0 | 0 | 0 | 1 | 65 | 25 | 141 | 1.10 | 298000 | 305 |
| 113 | 0 | 1 | 0 | 0 | 0 | 0 | 64 | 60 | 137 | 1.00 | 242000 | 1610 |
| 10 | 1 | 1 | 0 | 0 | 0 | 1 | 75 | 15 | 137 | 1.20 | 127000 | 246 |
Heart Attack: Unmasking the Silent Killer - Rumours in Epidemiology
Be data Driven or perish
The study aimed to analyze survival rates in heart failure patients admitted to the Institute of Cardiology and Allied Hospital Faisalabad, Pakistan, between April and December 2015. Participants were aged 40 or above, had left ventricular systolic dysfunction, and were classified under NYHA class III and IV. The study focused on 299 heart failure patients, including 105 women and 194 men, all over the age of 40 with left ventricular systolic dysfunction, classified as NYHA class III and IV. The follow-up period ranged from 4 to 285 days, averaging 130 days. Diagnoses were based on cardiac echo reports or physician notes. Variables considered for explaining CHD mortality included age, serum sodium, serum creatinine, gender, smoking, blood pressure, ejection fraction (EF), anemia, platelets, creatinine phosphokinase (CPK), and diabetes. Continuous variables were age, serum sodium, and CPK, while categorical variables included EF, serum creatinine, and platelets. EF was categorized into three levels (EF ≤30, 30< EF ≤45, and EF >45), and platelets were divided into three levels based on quartiles.
Snapshot of our initial dataset
Explanatory data analysis
Correlation
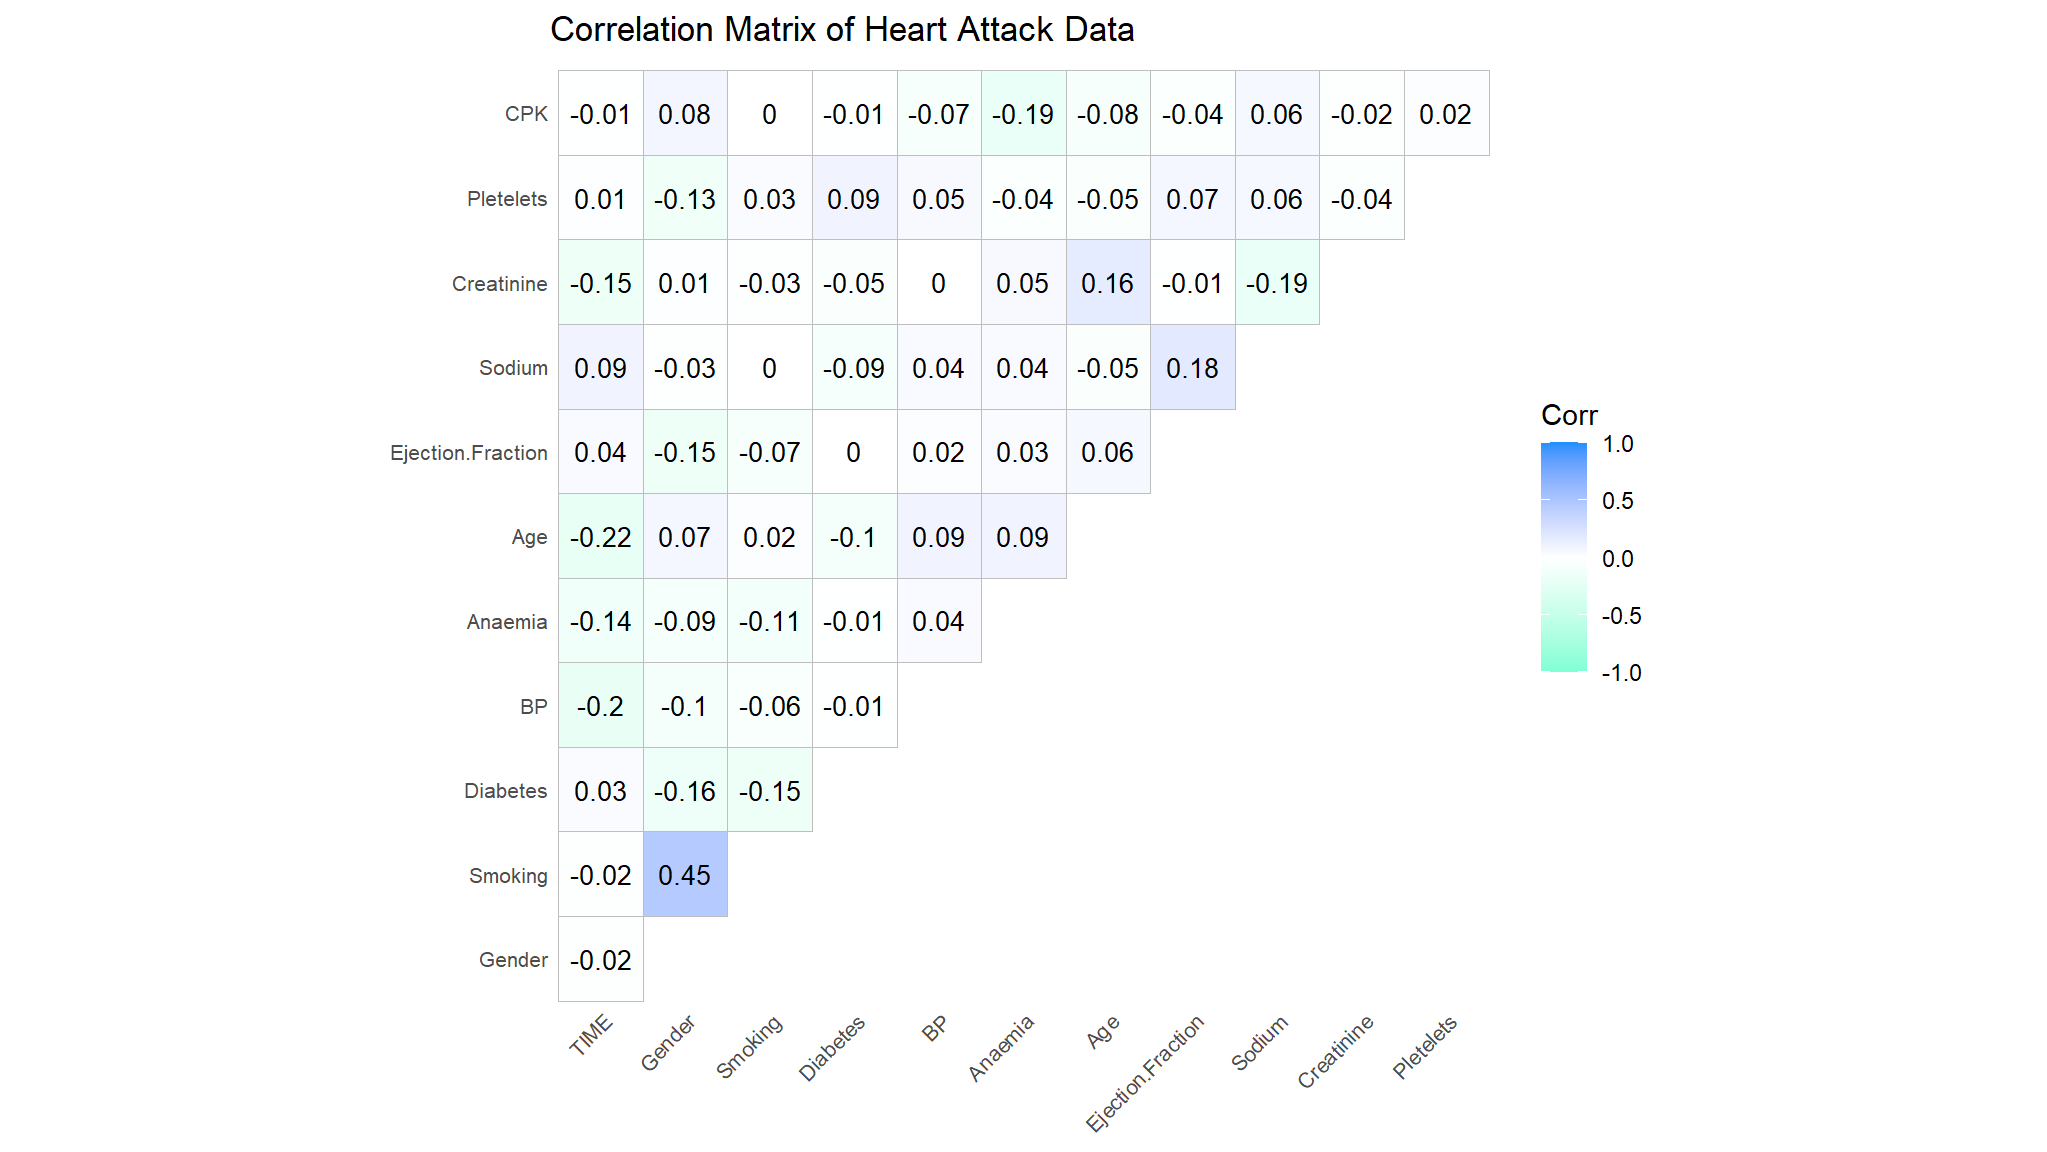
- There are no significant correlations among these variables
Exploring Age
- distribution of Age
#> Minimum: 40.00
#> Mean: 60.83
#> Median: 60.00
#> Mode: 60.00
#> Maximum: 95.00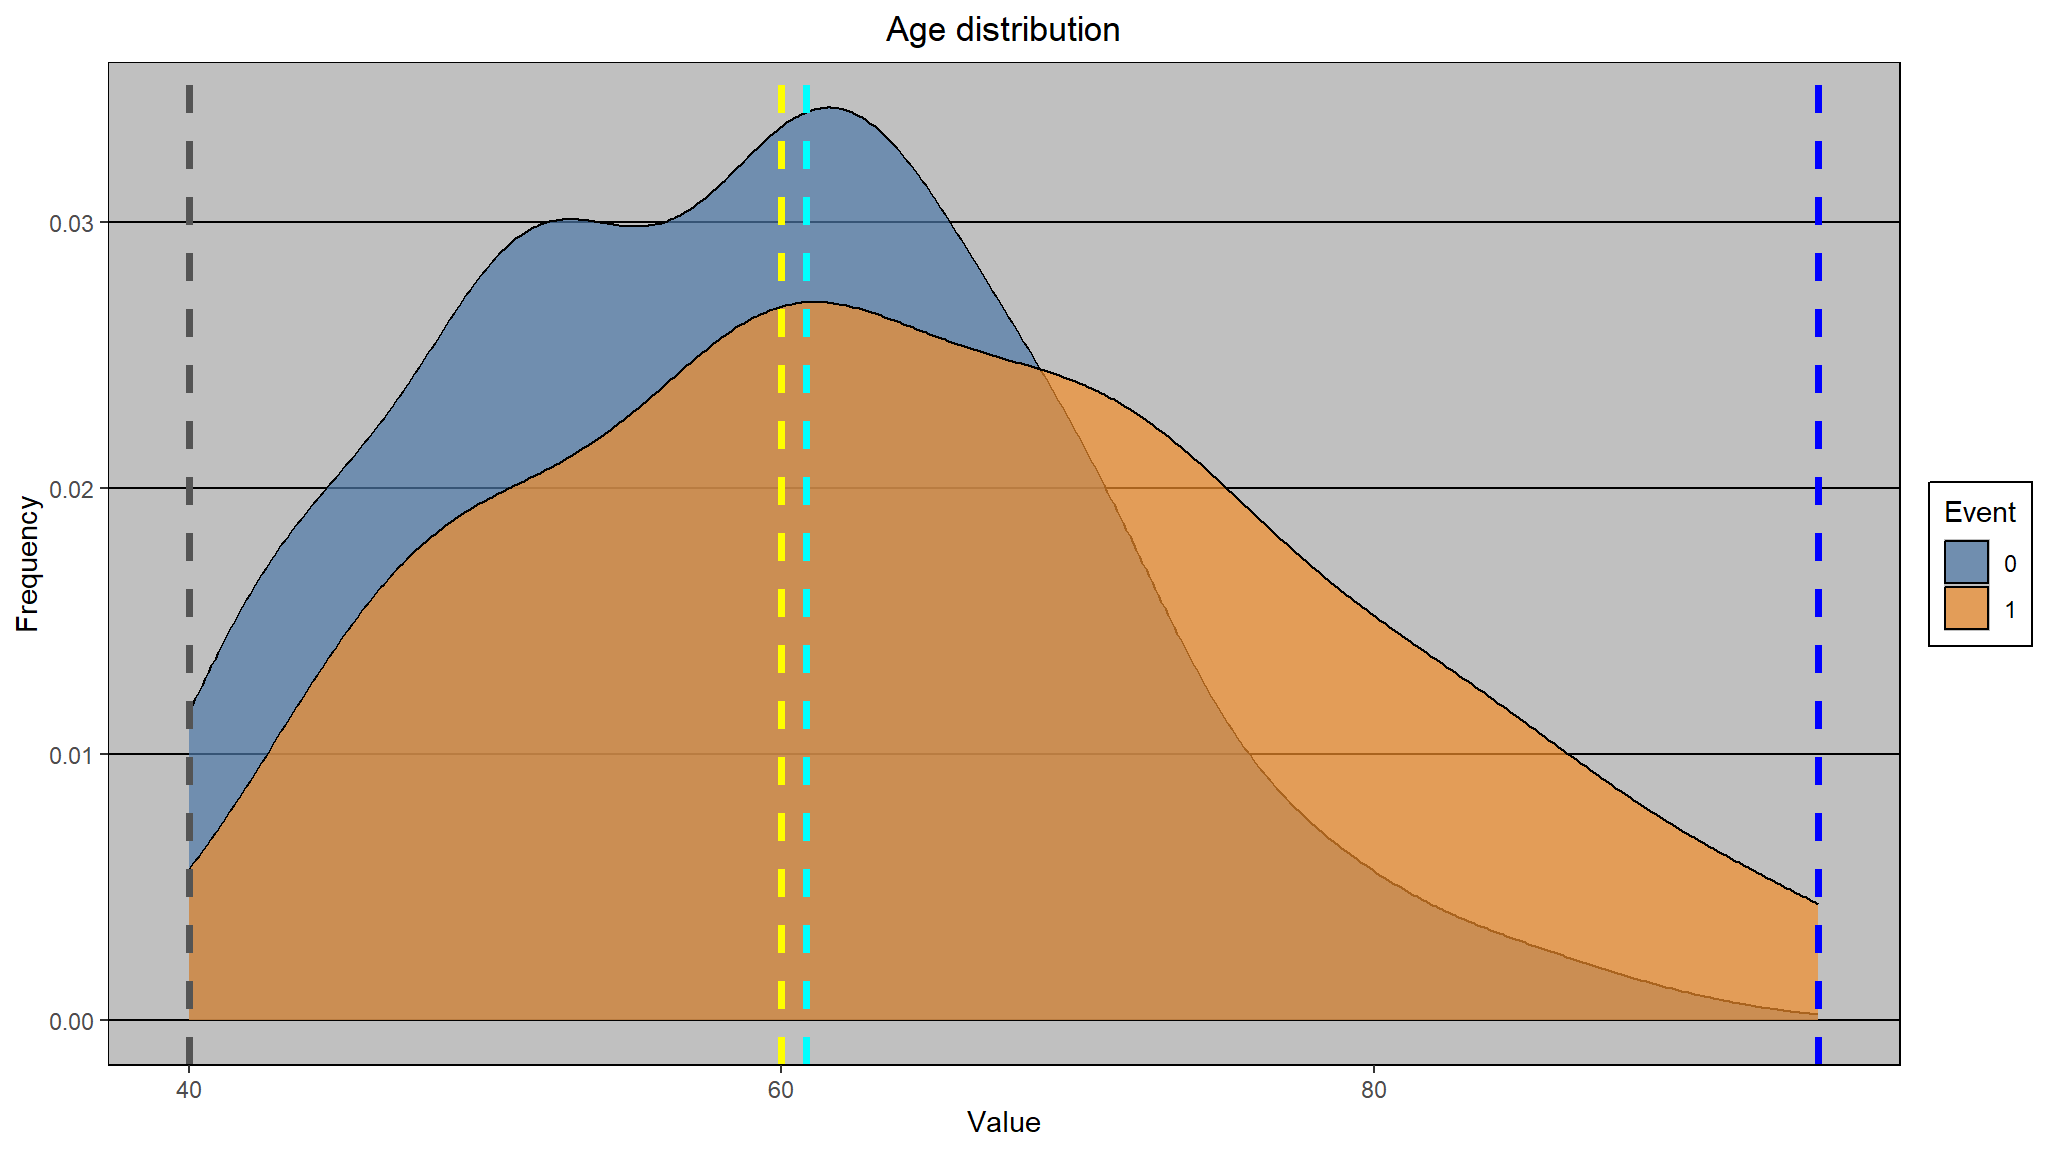
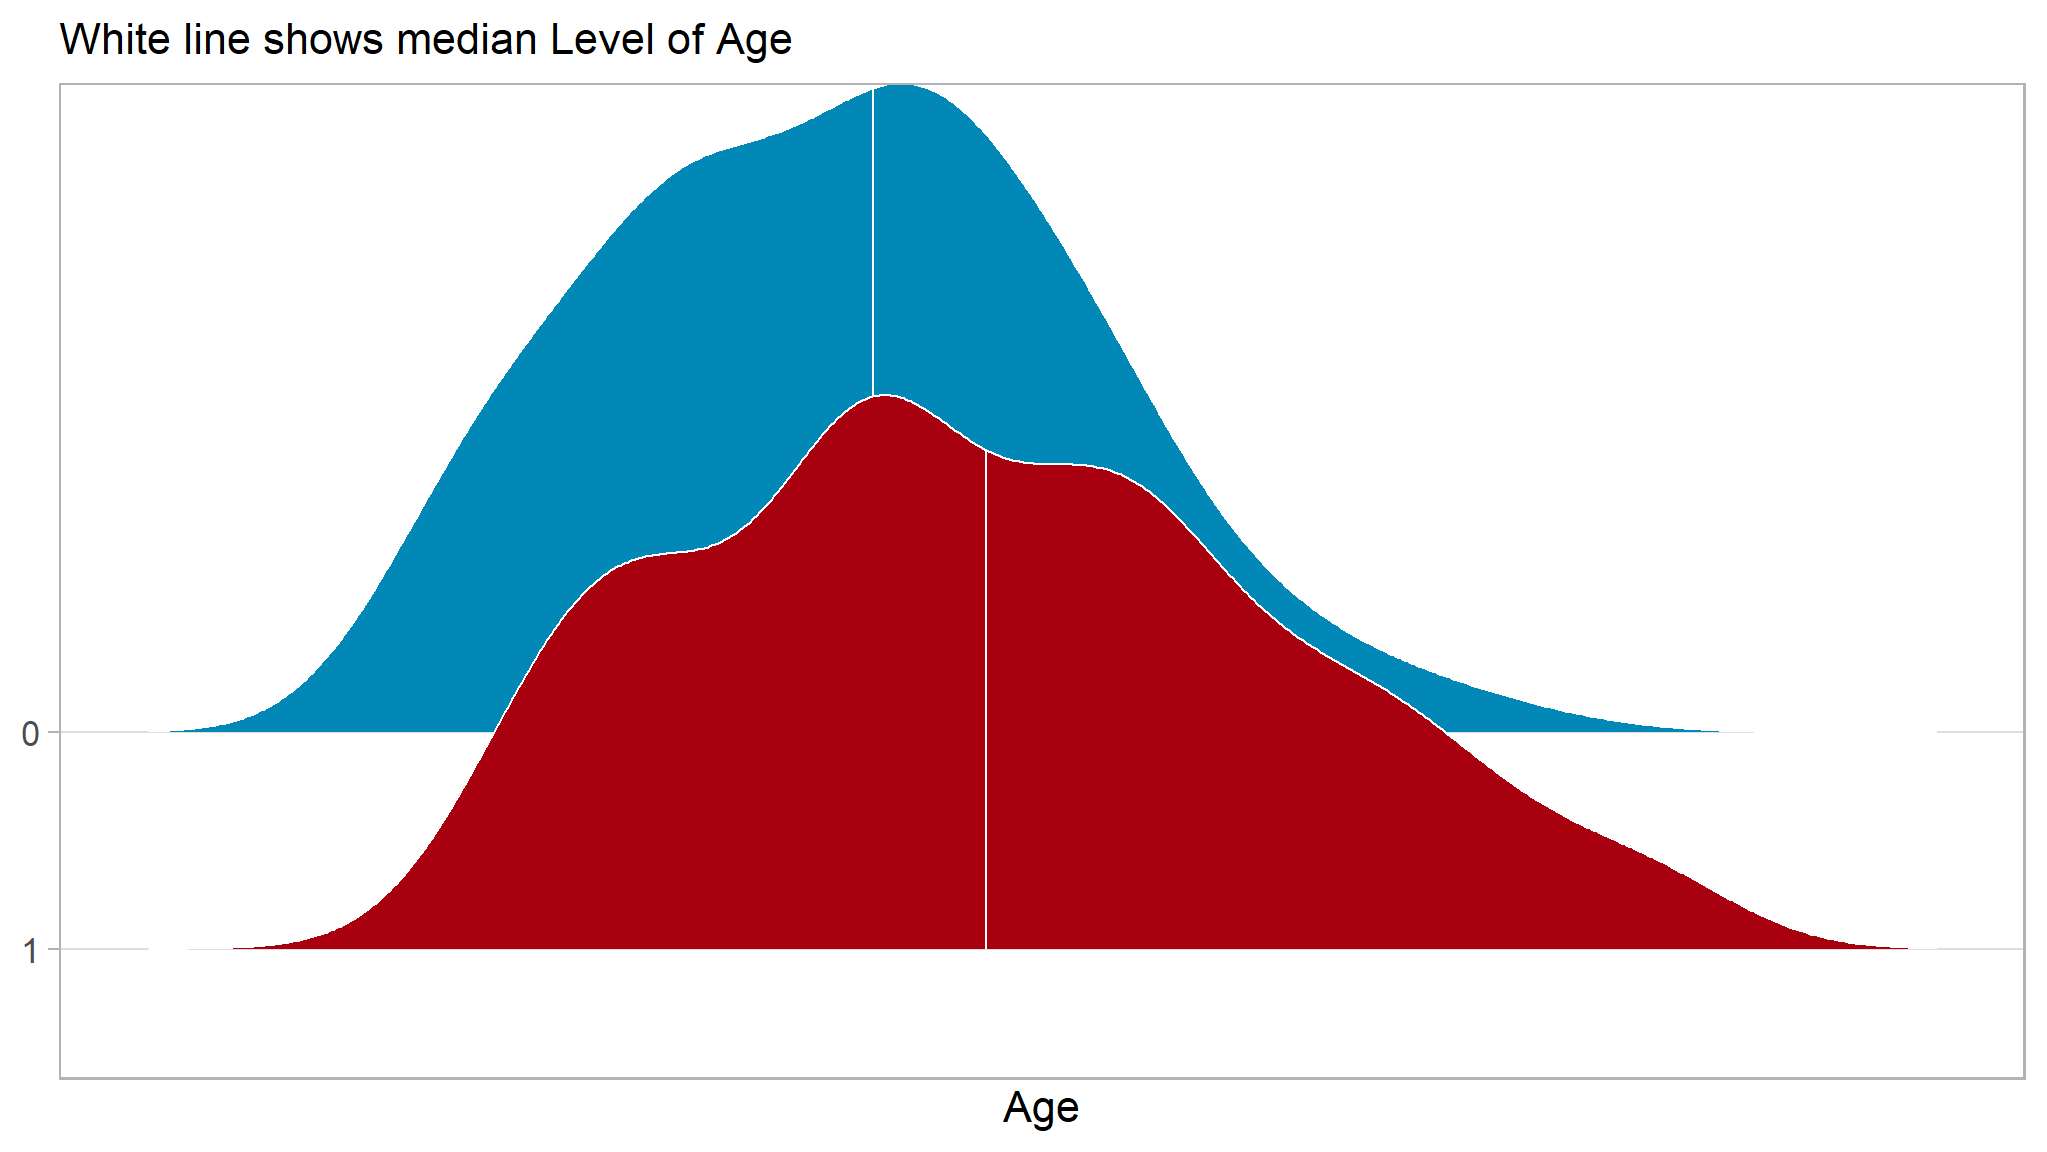
- The minimum age for patients in this study is 40 while the maximum is 95.
- On average the patients were aged 60 years
Distribution of Ejection Fraction
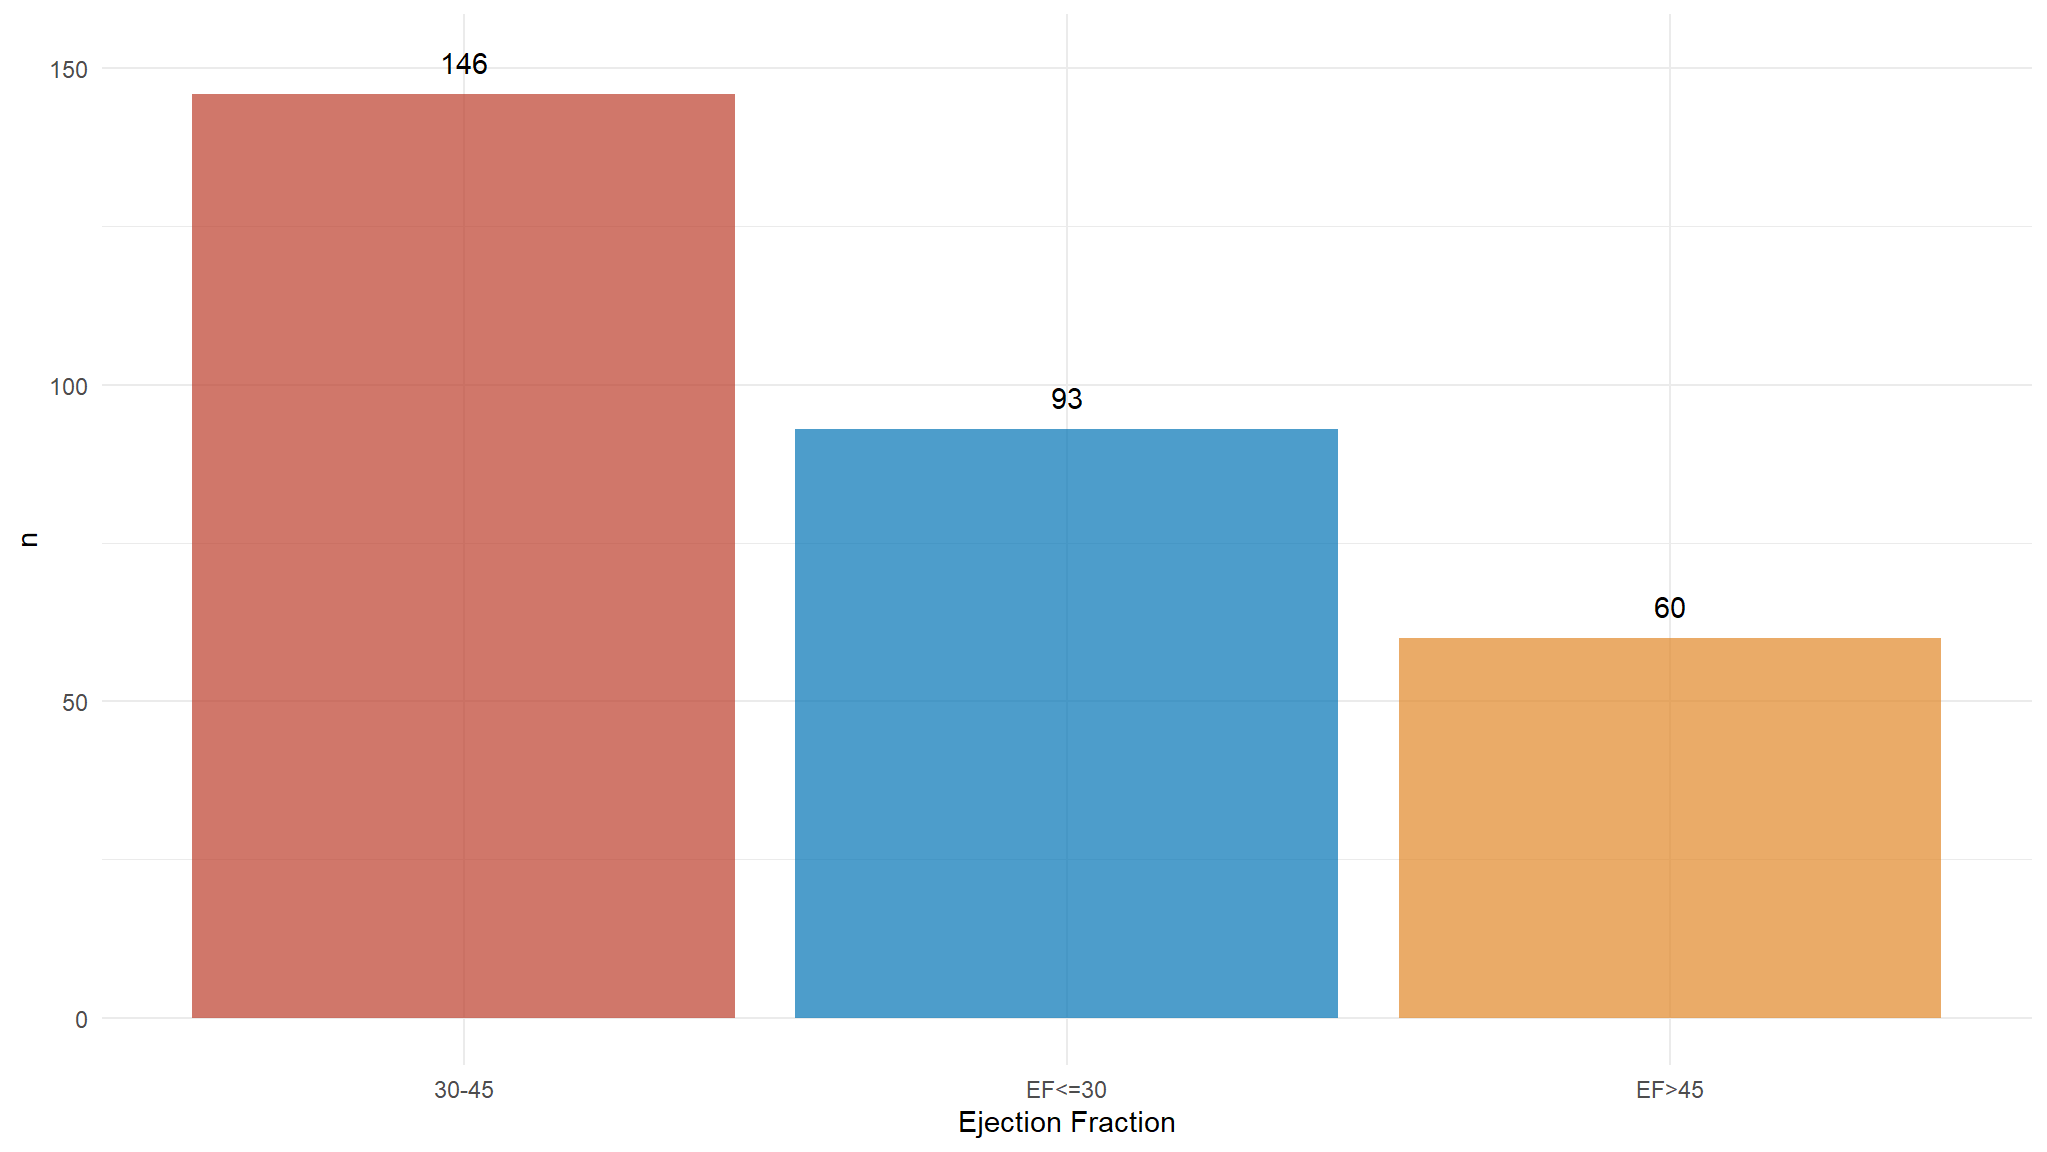
- The plot above shows the number of patients in each Ejection Fraction Category.
- the majority of patients where in the 30 <EF<=45 category
Mortality Rate
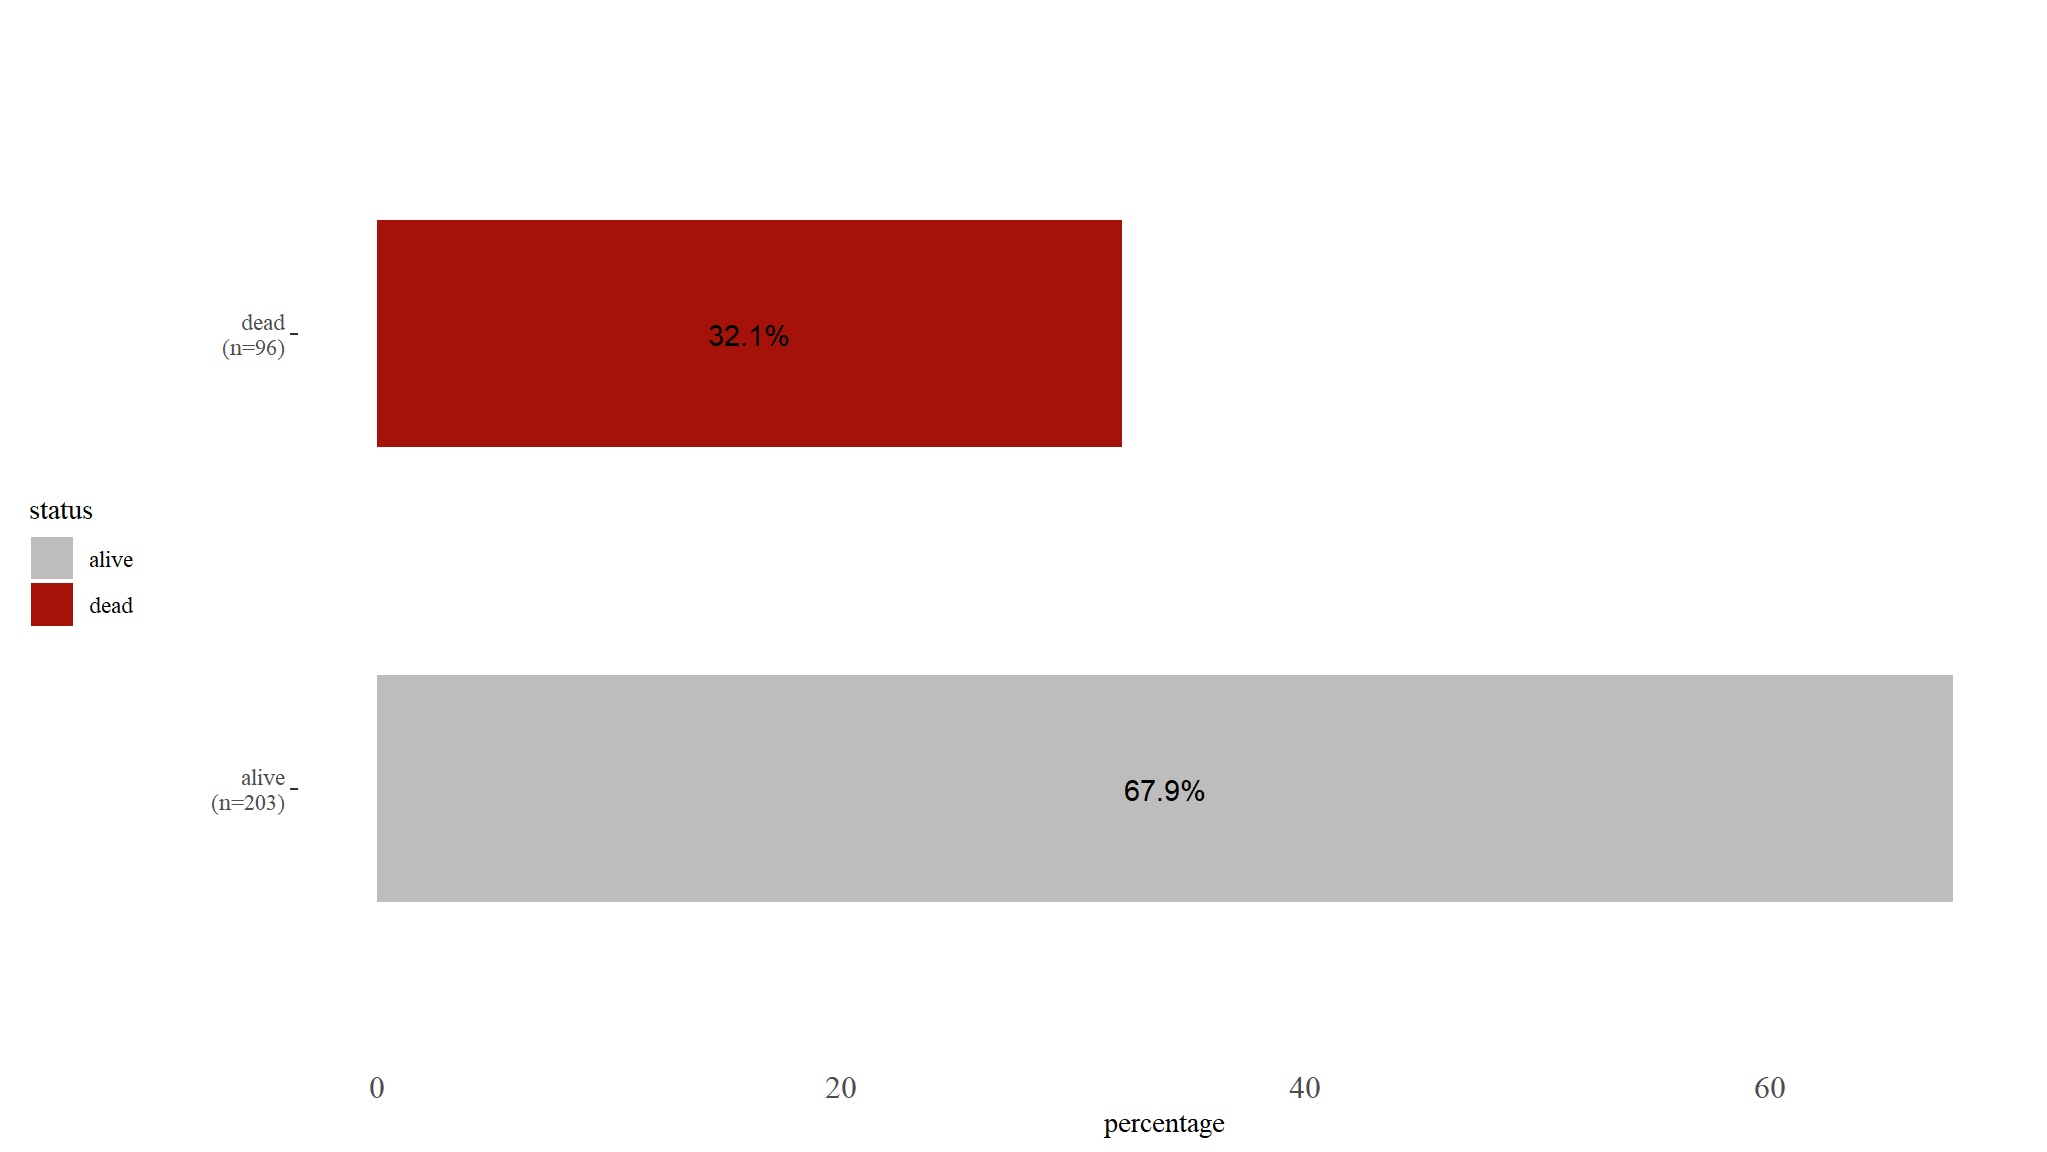
- the study shows that 32.1% of the patients died and the remaining censored or were lost to followup.
Event vs Ejection Fraction
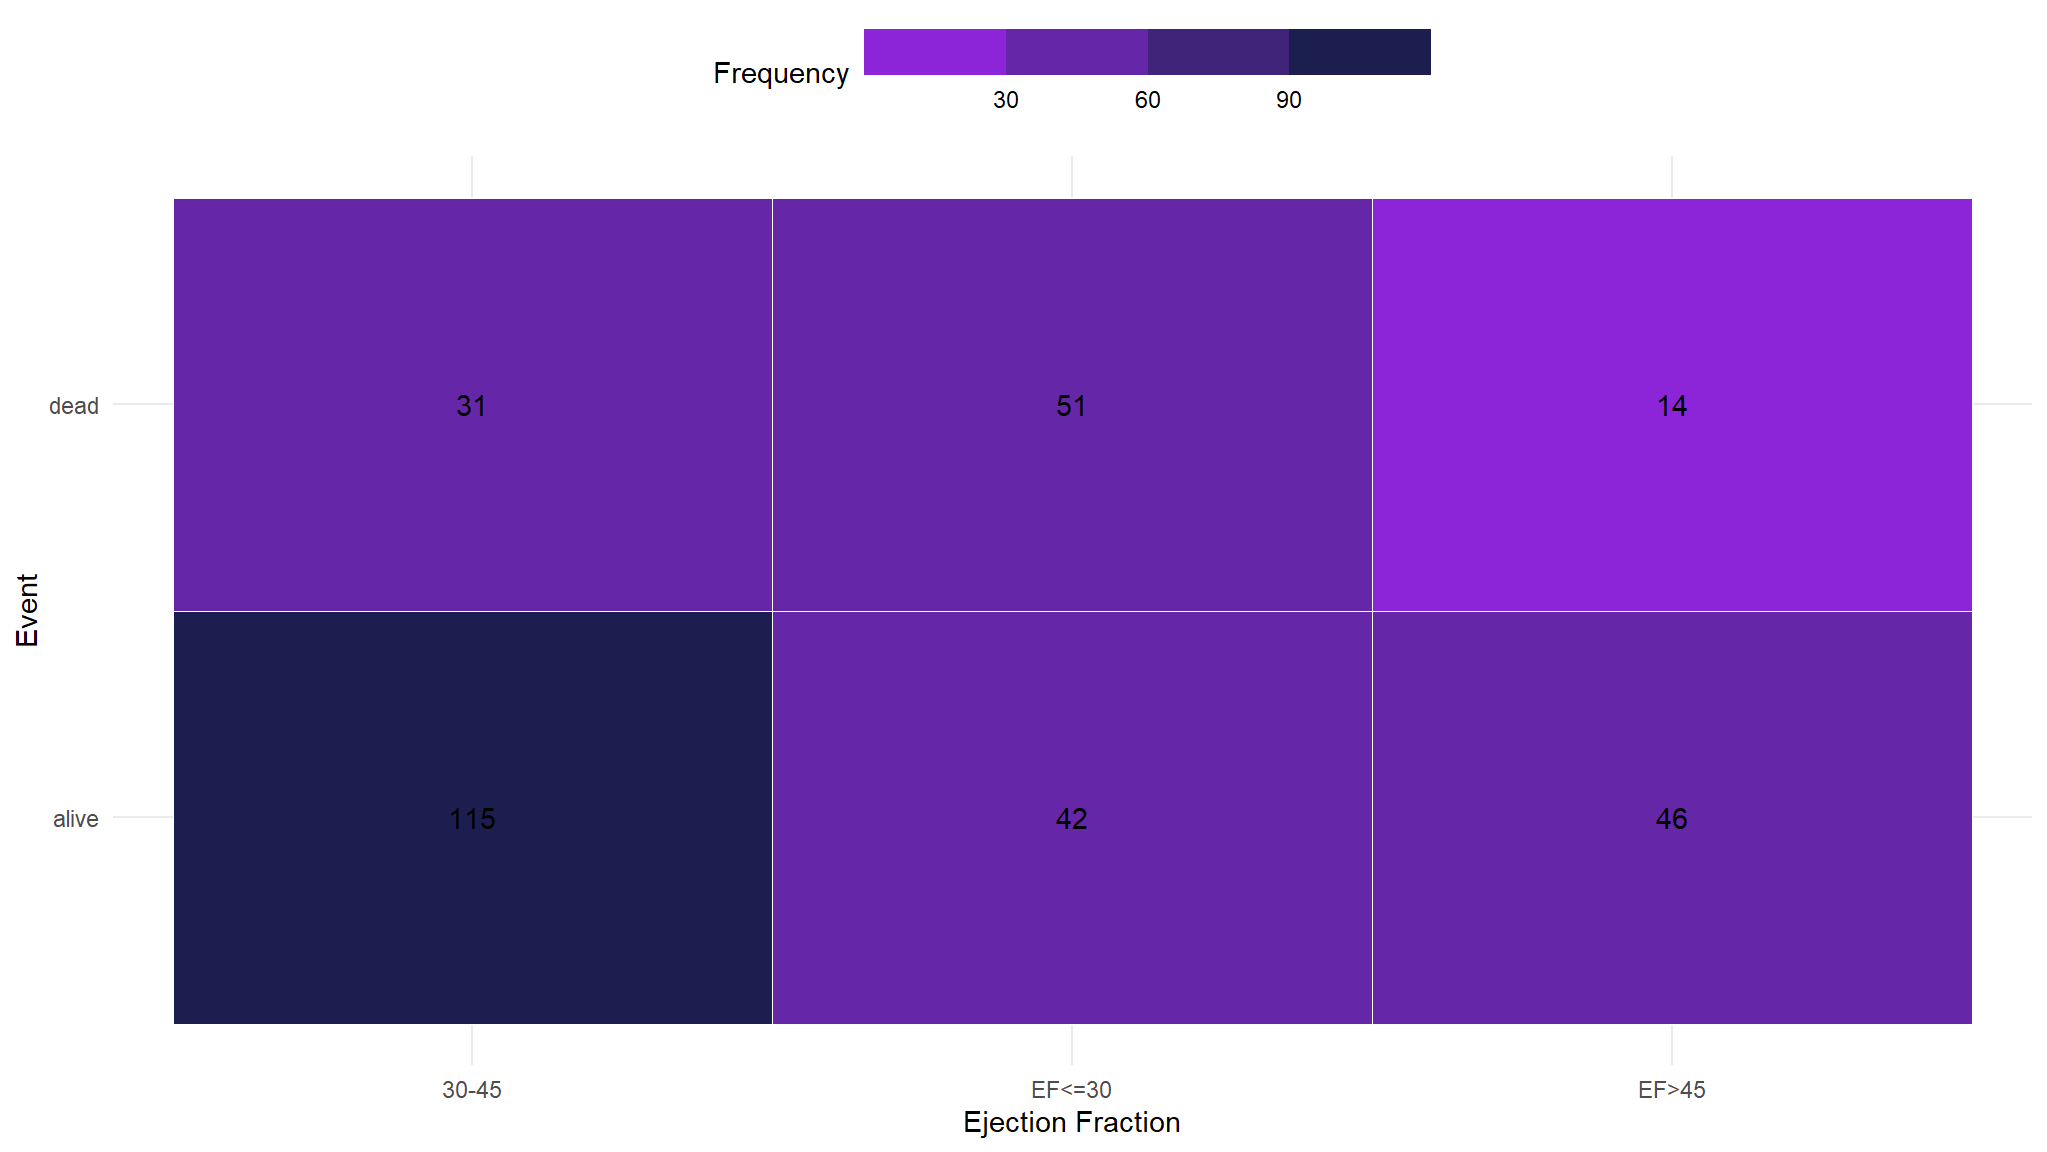
- among the patients who died from Heart Attack , majority of the patients had Ejection Fraction less than 30 (EF<=30)
A Closer look at Ejection Fraction.
| EFraction_cat | n_dead | n_total | pct_dead | low | high | pct |
|---|---|---|---|---|---|---|
| EF<=30 (93) | 51 | 93 | 0.5483871 | 0.4701115 | 0.6643073 | 0.3110368 |
| EF>45 (60) | 14 | 60 | 0.2333333 | 0.1875604 | 0.4047309 | 0.2006689 |
| 30-45 (146) | 31 | 146 | 0.2123288 | 0.1735042 | 0.3083021 | 0.4882943 |
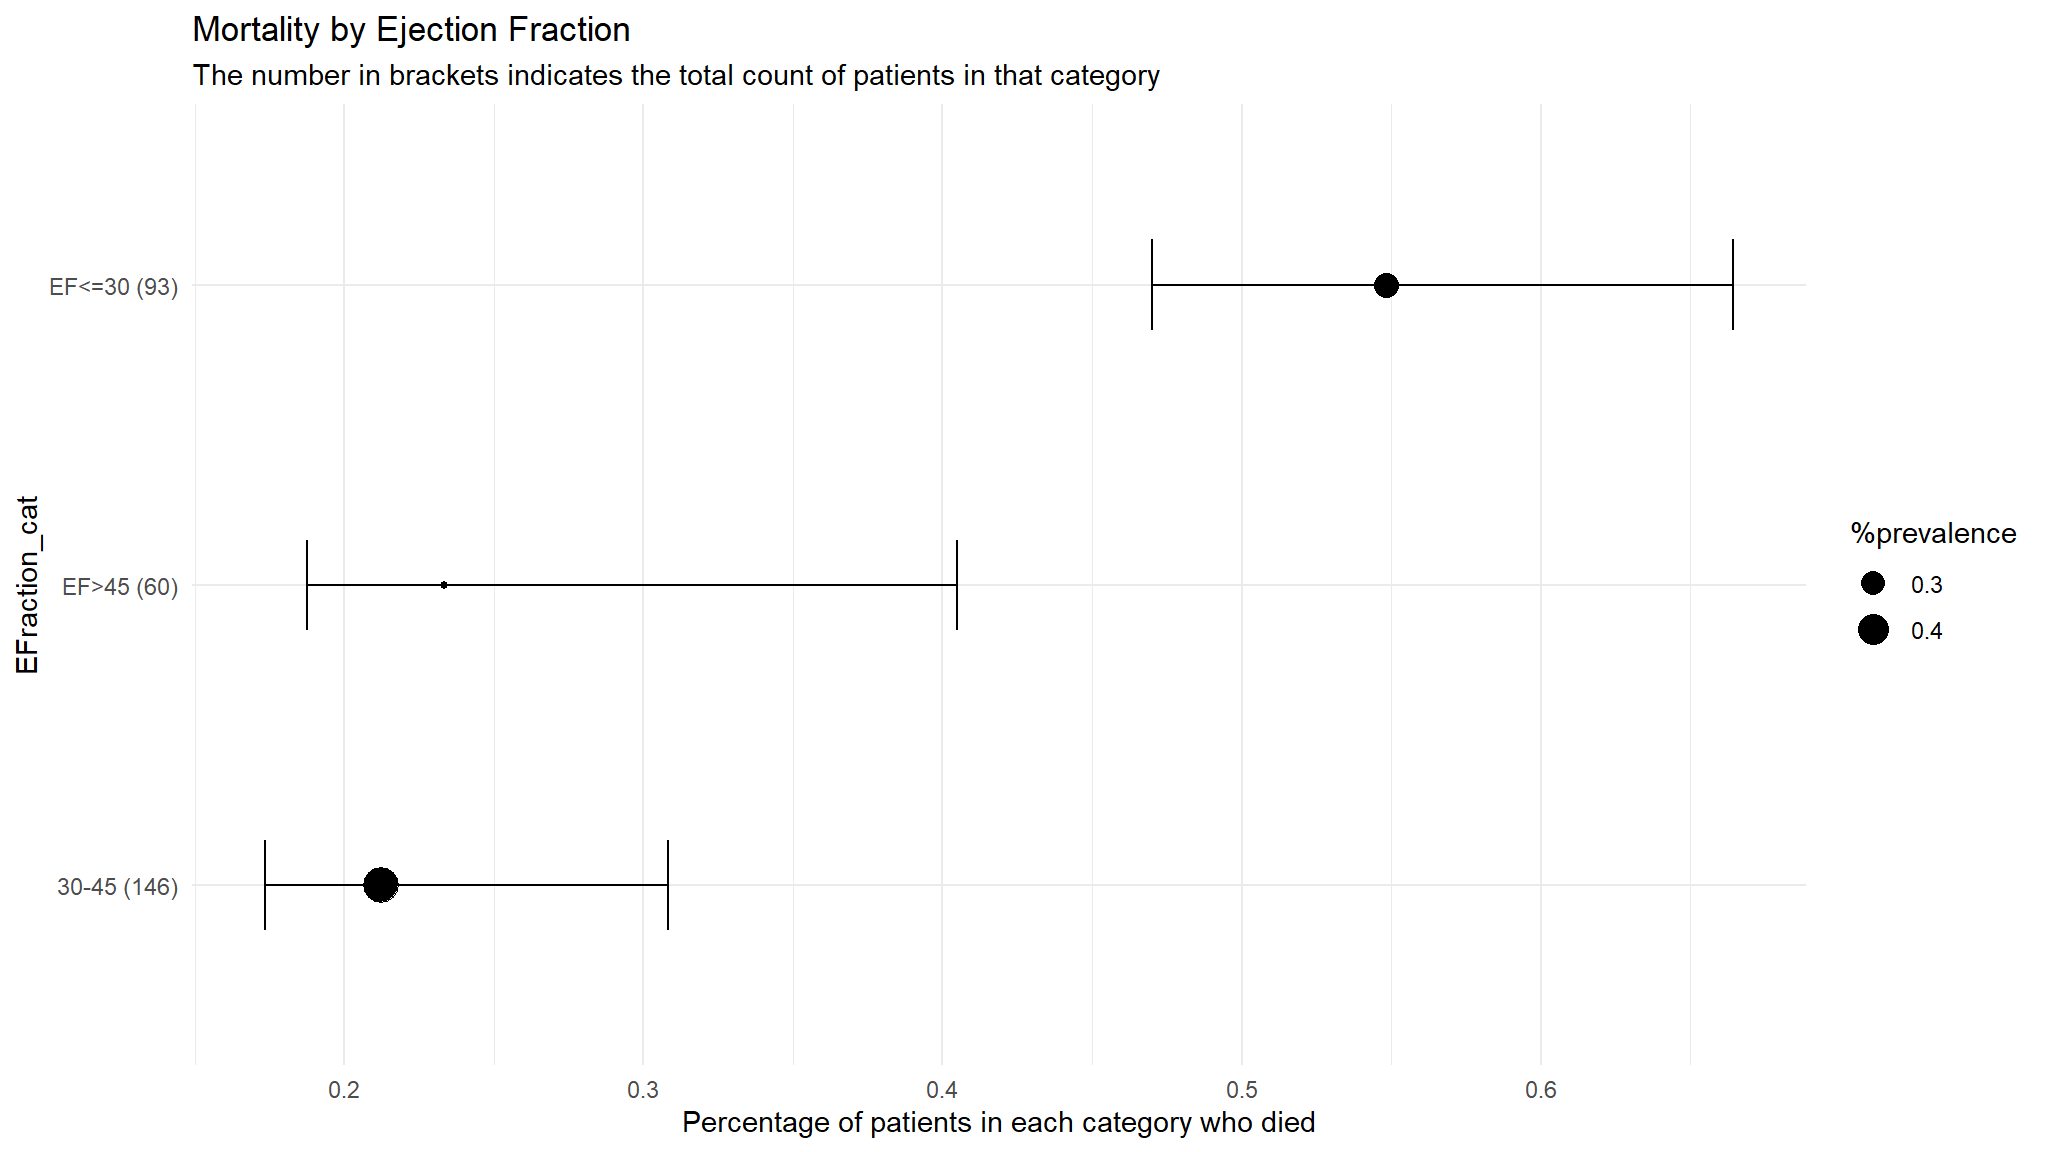
- out of the total number of people in each category , we get the proportion of patients who died.
- it can be noted that for patients who had Ejection Fraction less than 30 , a number of them died to heart attack.
Statistical Analysis
Chi squared tests
| Characteristic | alive, N = 2031 | dead, N = 961 | Test Statistic | p-value2 |
|---|---|---|---|---|
| BP | 1.9 | 0.17 | ||
| No | 137 / 203 (67%) | 57 / 96 (59%) | ||
| Yes | 66 / 203 (33%) | 39 / 96 (41%) | ||
| platelets_cat | 3.5 | 0.17 | ||
| < Q1 | 61 / 203 (30%) | 39 / 96 (41%) | ||
| < Q2 | 73 / 203 (36%) | 27 / 96 (28%) | ||
| < Q3 | 69 / 203 (34%) | 30 / 96 (31%) | ||
| EFraction_cat | 32 | <0.001 | ||
| 30-45 | 115 / 203 (57%) | 31 / 96 (32%) | ||
| EF<=30 | 42 / 203 (21%) | 51 / 96 (53%) | ||
| EF>45 | 46 / 203 (23%) | 14 / 96 (15%) | ||
| Diabetes | 0.00 | 0.97 | ||
| No | 118 / 203 (58%) | 56 / 96 (58%) | ||
| Yes | 85 / 203 (42%) | 40 / 96 (42%) | ||
| Smoking | 0.05 | 0.83 | ||
| No | 137 / 203 (67%) | 66 / 96 (69%) | ||
| Yes | 66 / 203 (33%) | 30 / 96 (31%) | ||
| Anaemia | 1.3 | 0.25 | ||
| No | 120 / 203 (59%) | 50 / 96 (52%) | ||
| Yes | 83 / 203 (41%) | 46 / 96 (48%) | ||
| Gender | 0.01 | 0.94 | ||
| F | 71 / 203 (35%) | 34 / 96 (35%) | ||
| M | 132 / 203 (65%) | 62 / 96 (65%) | ||
| 1 n / N (%) | ||||
| 2 Pearson’s Chi-squared test | ||||
The chi-squared test of association tells us that only Ejection Fraction is significantly associated to the Outcome event at 5% level of significance.
take a closer look at the previous finding
| event_cat | EFraction_cat | Total | ||
| 30-45 | EF<=30 | EF>45 | ||
| alive |
115 56.7 % |
42 20.7 % |
46 22.7 % |
203 100 % |
| dead |
31 32.3 % |
51 53.1 % |
14 14.6 % |
96 100 % |
| Total |
146 48.8 % |
93 31.1 % |
60 20.1 % |
299 100 % |
#>
#> --------Summary descriptives table by 'event_cat'---------
#>
#> ______________________________________________________________
#>                   alive       dead           OR        p-value
#>                   N=203       N=96
#> ¯¯¯¯¯¯¯¯¯¯¯¯¯¯¯¯¯¯¯¯¯¯¯¯¯¯¯¯¯¯¯¯¯¯¯¯¯¯¯¯¯¯¯¯¯¯¯¯¯¯¯¯¯¯¯¯¯¯¯¯¯¯
#> EFraction_cat:
#>     30-45      115 (56.7%) 31 (32.3%)       Ref.        Ref.
#>     EF<=30     42 (20.7%)  51 (53.1%) 4.46 [2.54;7.98] <0.001
#>     EF>45      46 (22.7%)  14 (14.6%) 1.13 [0.54;2.30]  0.735
#> ¯¯¯¯¯¯¯¯¯¯¯¯¯¯¯¯¯¯¯¯¯¯¯¯¯¯¯¯¯¯¯¯¯¯¯¯¯¯¯¯¯¯¯¯¯¯¯¯¯¯¯¯¯¯¯¯¯¯¯¯¯¯- The prelimenary analysis using statistical inference shows that
Patients with EF less than 30 have increased odds of dying from heart attack [2.54 ; 7.98] , this result is also statistically significant at 5% level of significance.
- we will find more on the models that come.
Boxplots
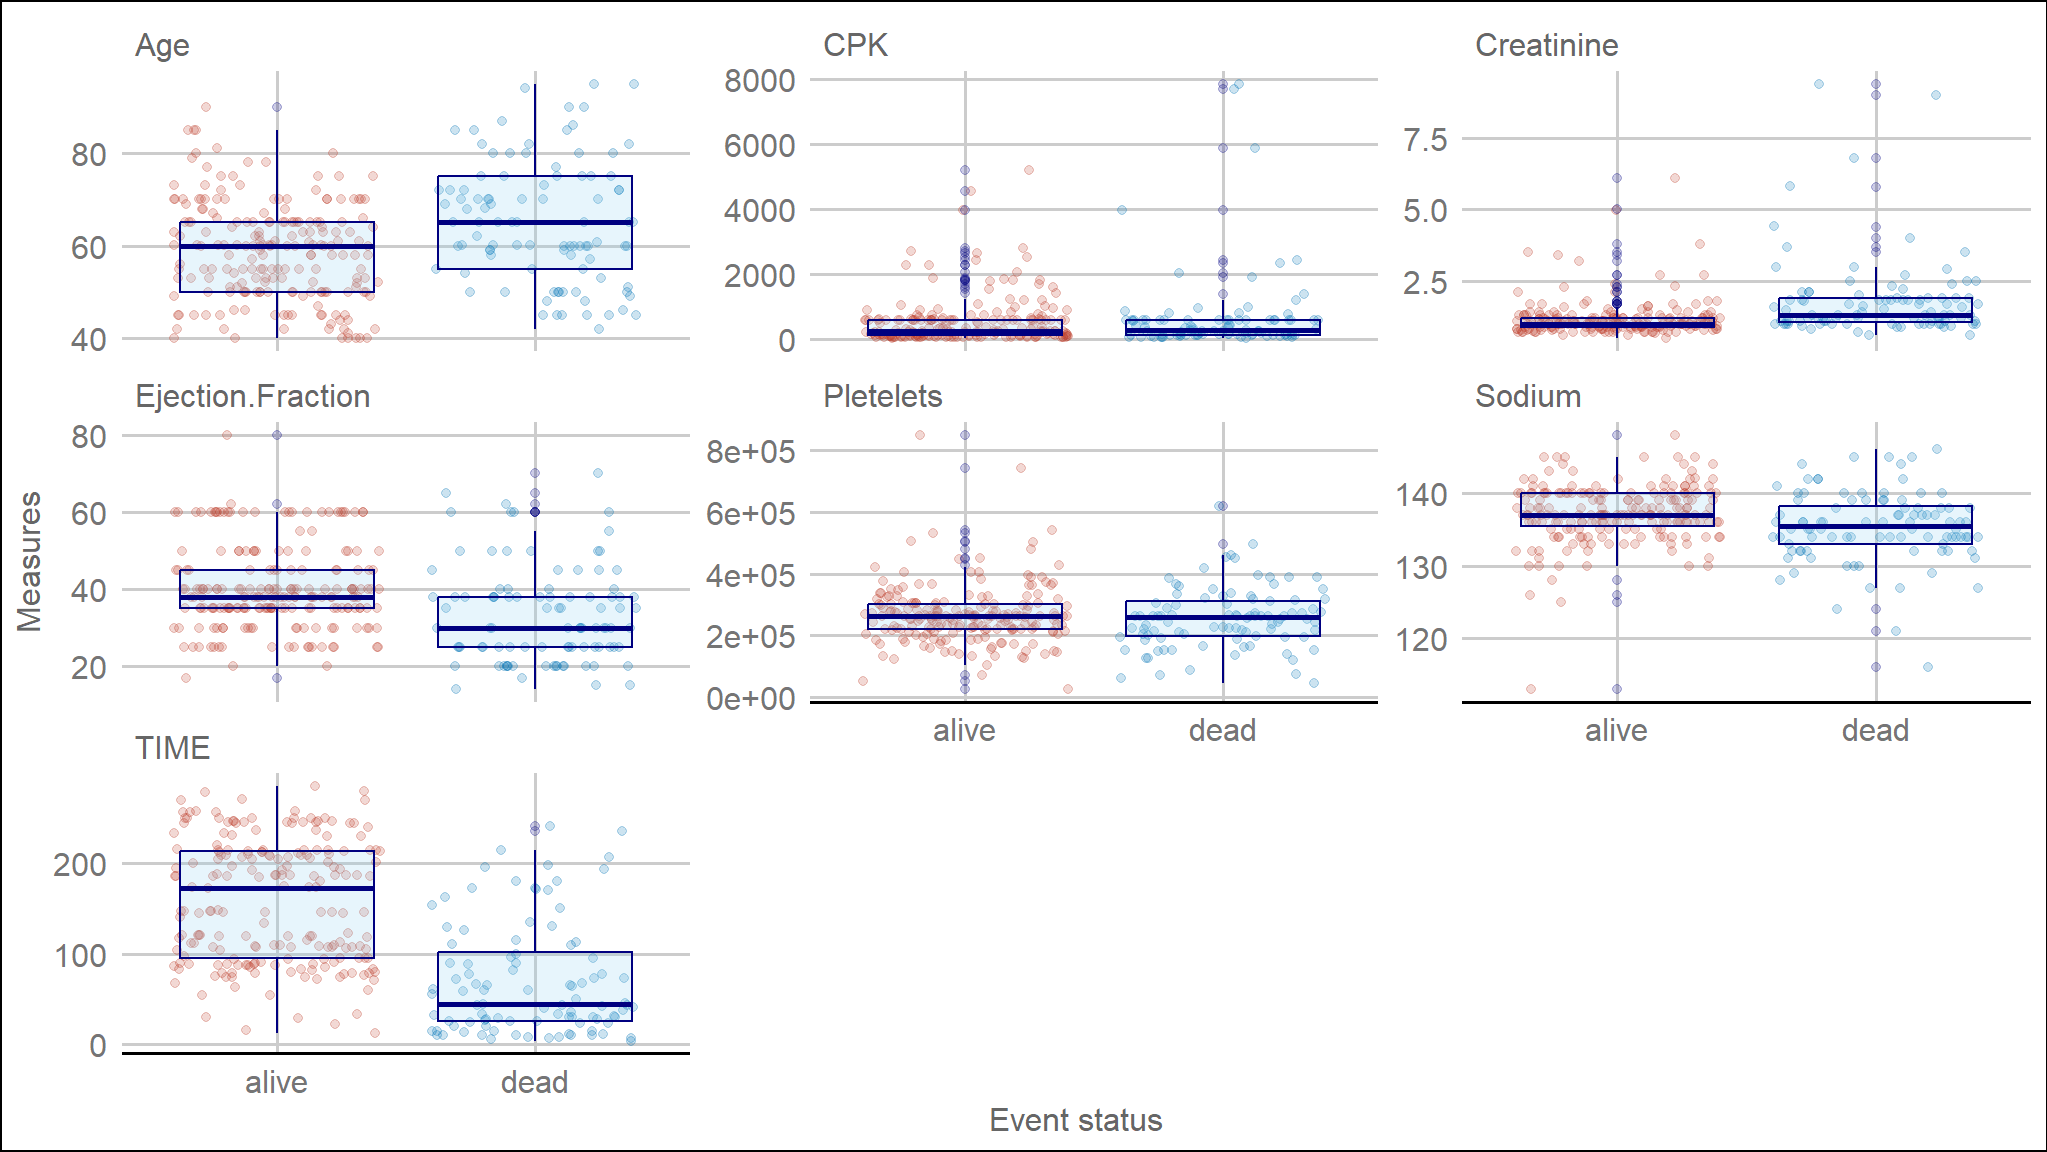
- it should be noted that there is some difference in Ejection Fraction between between people who died and those who survived.
- we will try to answer more using a t.test
T test
| Characteristic | alive, N = 2031 | dead, N = 961 | Difference2 | 95% CI2,3 | p-value2 |
|---|---|---|---|---|---|
| Age | 59 (11) | 65 (13) | -6.5 | -9.5, -3.4 | <0.001 |
| Sodium | 137.2 (4.0) | 135.4 (5.0) | 1.8 | 0.69, 3.0 | 0.002 |
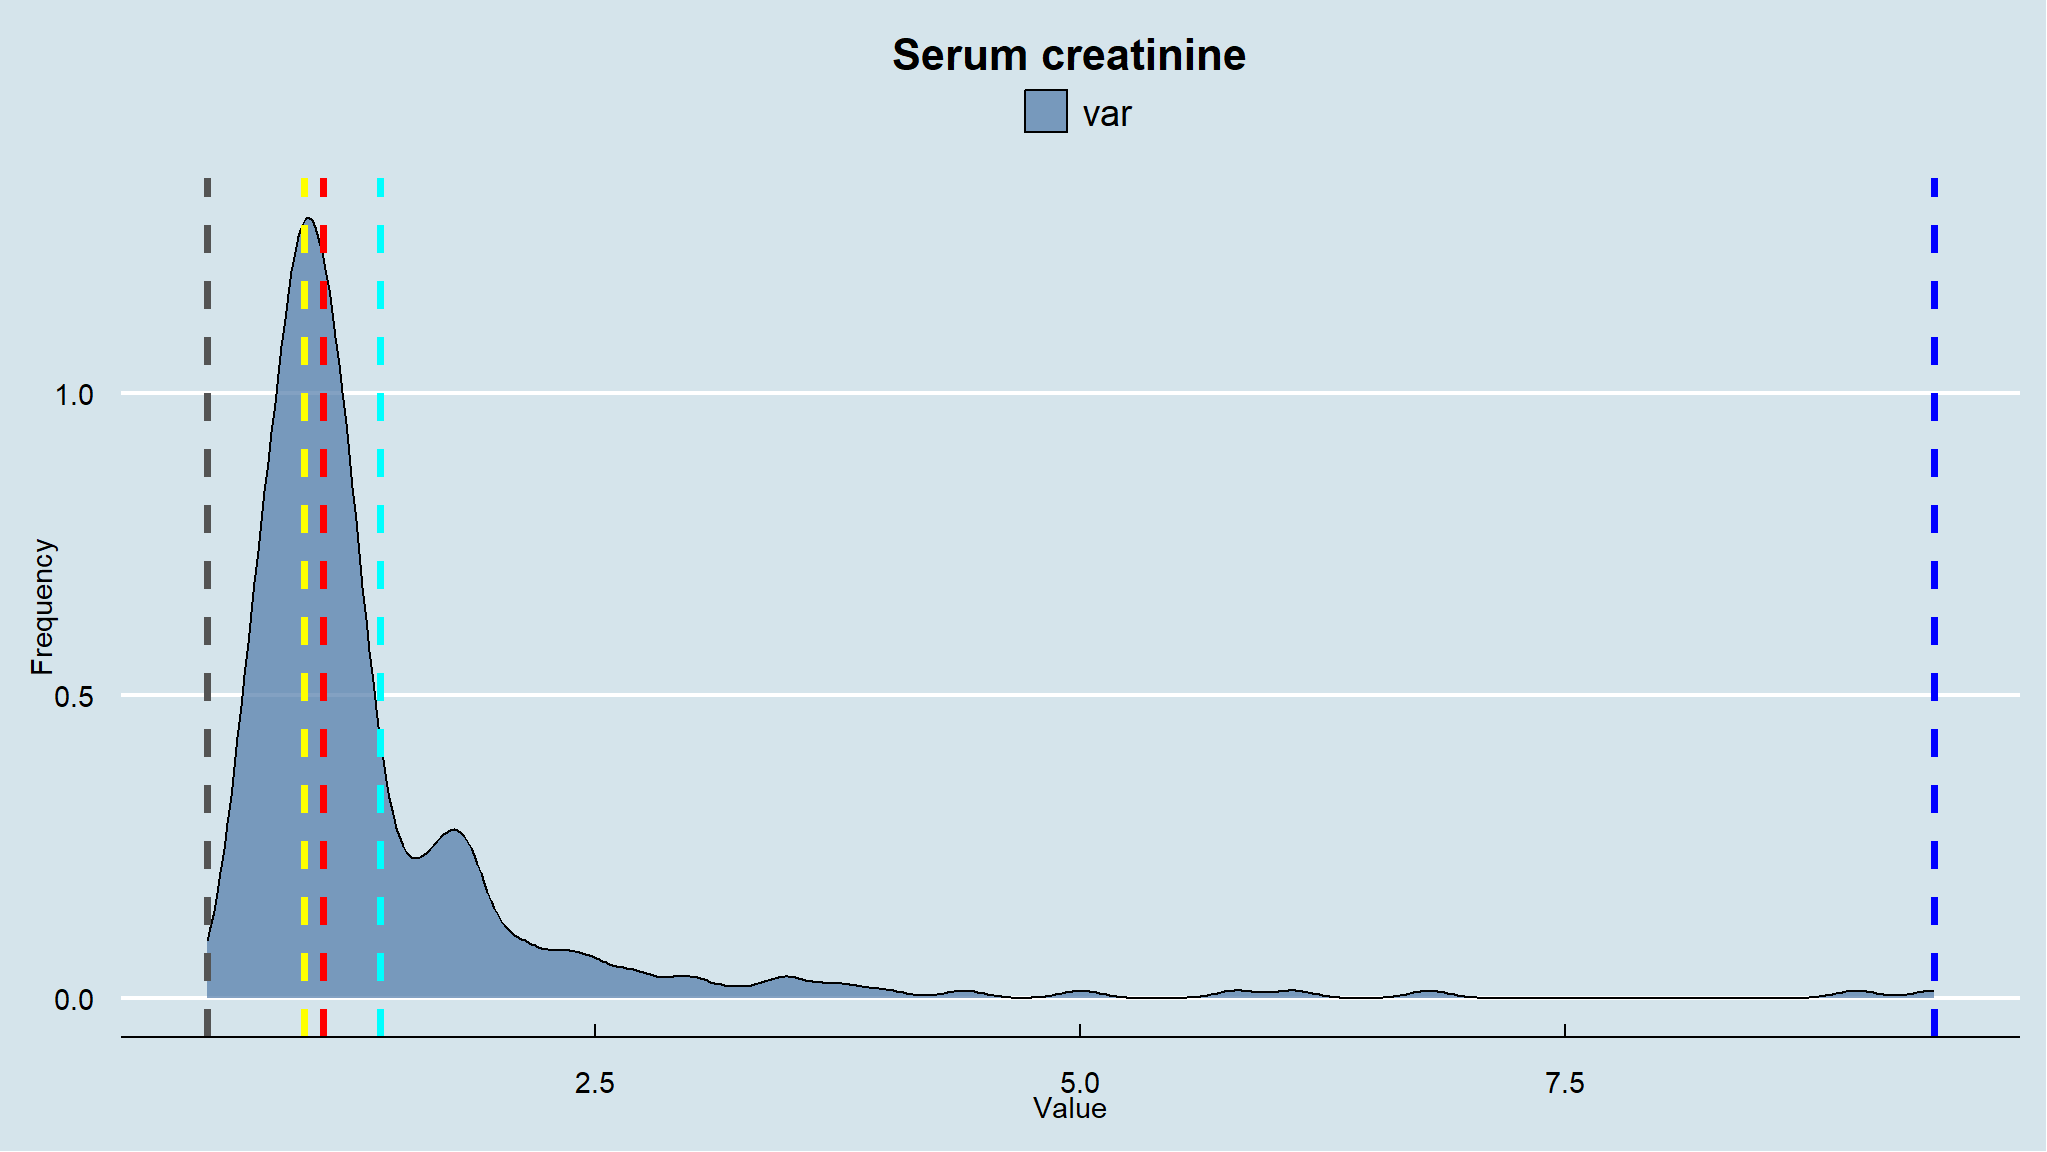
| Creatinine | 1.18 (0.65) | 1.84 (1.47) | -0.65 | -0.96, -0.34 | <0.001 |
| Ejection.Fraction | 40 (11) | 33 (13) | 6.8 | 3.9, 9.7 | <0.001 |
| TIME | 158 (68) | 71 (62) | 87 | 72, 103 | <0.001 |
| Pletelets | 266,657 (97,531) | 256,381 (98,526) | 10,276 | -13,723, 34,276 | 0.4 |
| CPK | 540 (754) | 670 (1,317) | -130 | -416, 156 | 0.4 |
| 1 Mean (SD) | |||||
| 2 Welch Two Sample t-test | |||||
| 3 CI = Confidence Interval | |||||
Comments
- The table above shows that there is significant difference in mean Age,Sodium,Creatinine and mean Ejection Fraction implying that the differences in the averages is not merely an outcome of chance
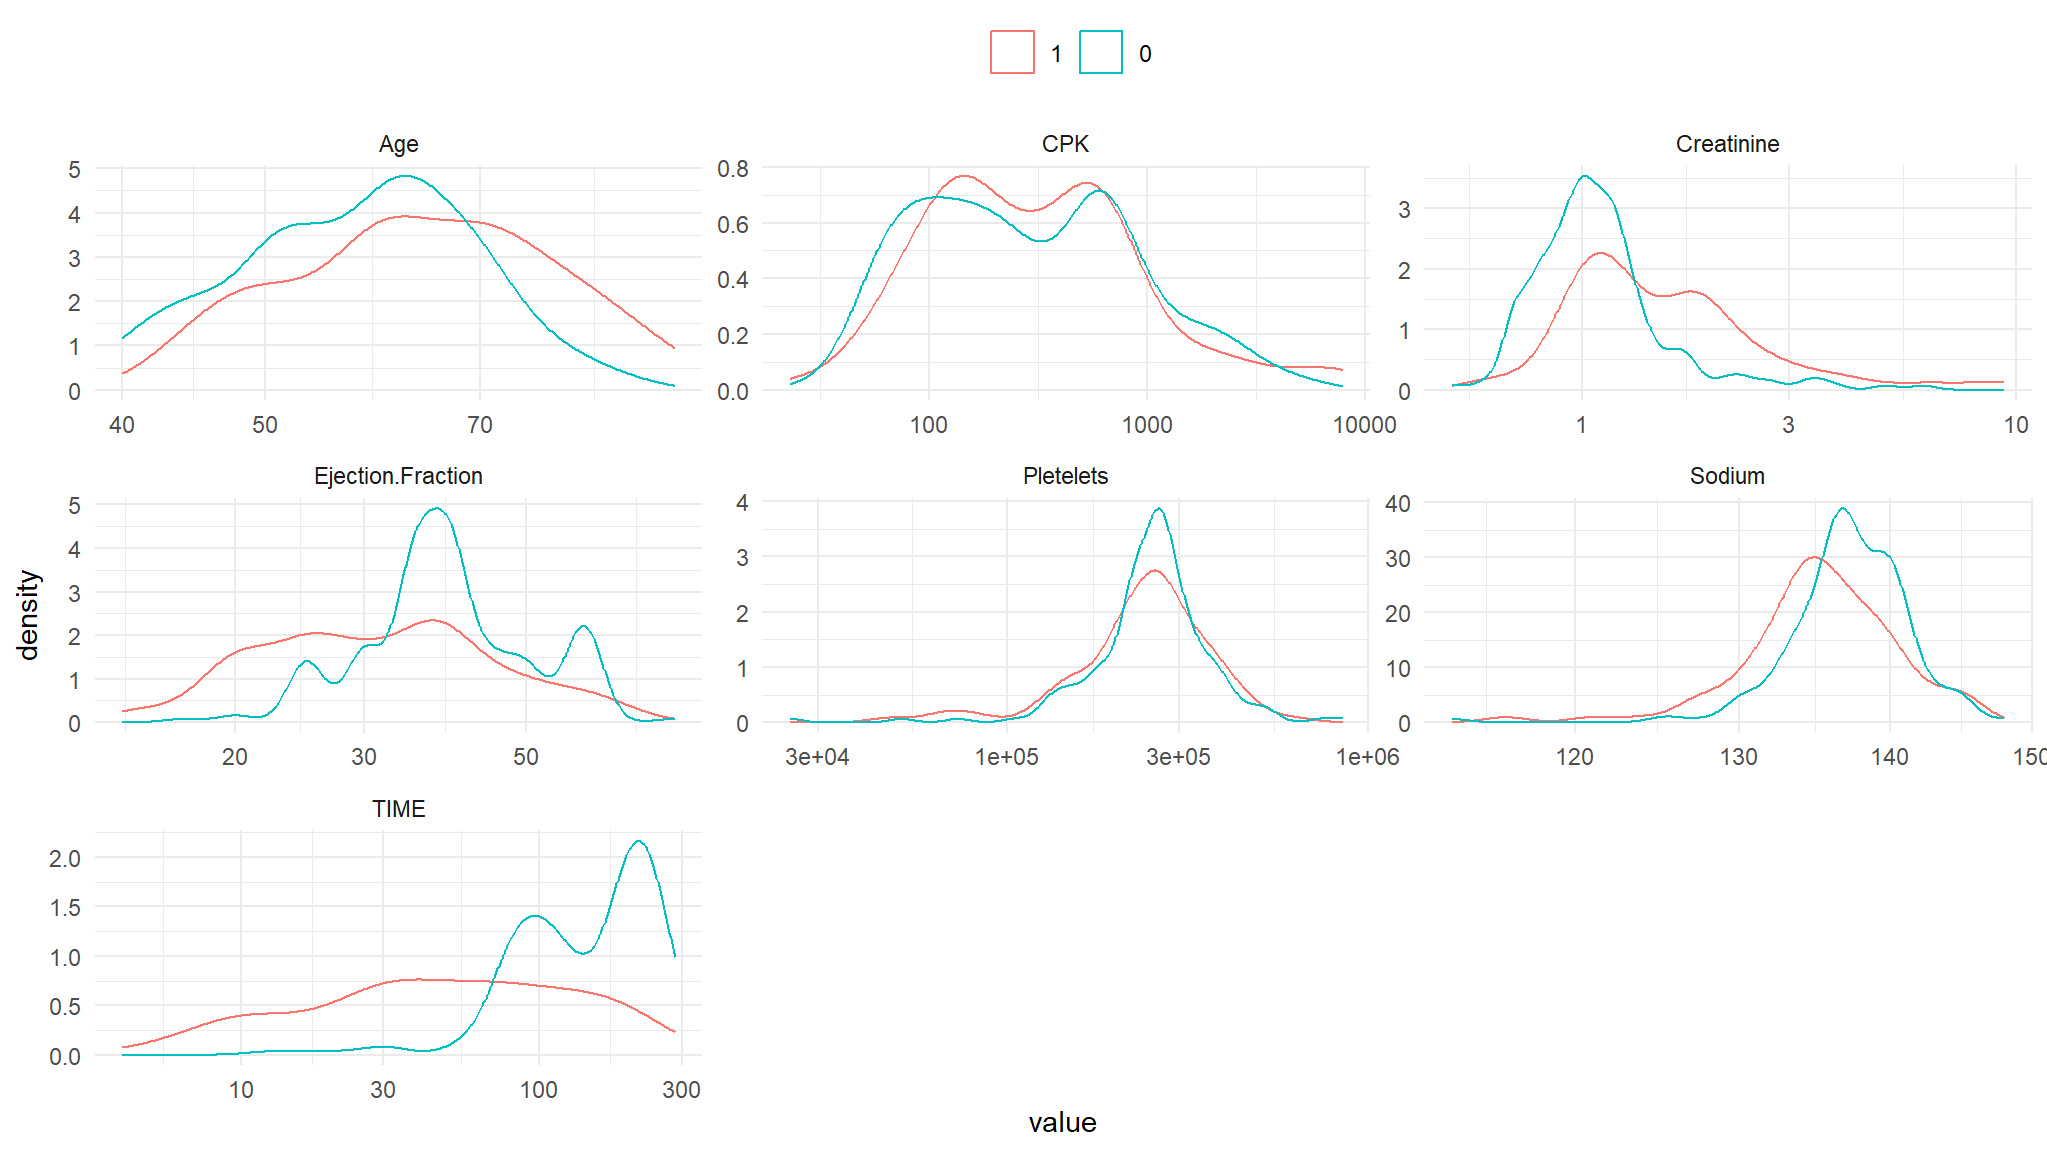
Taking the variables one at a time
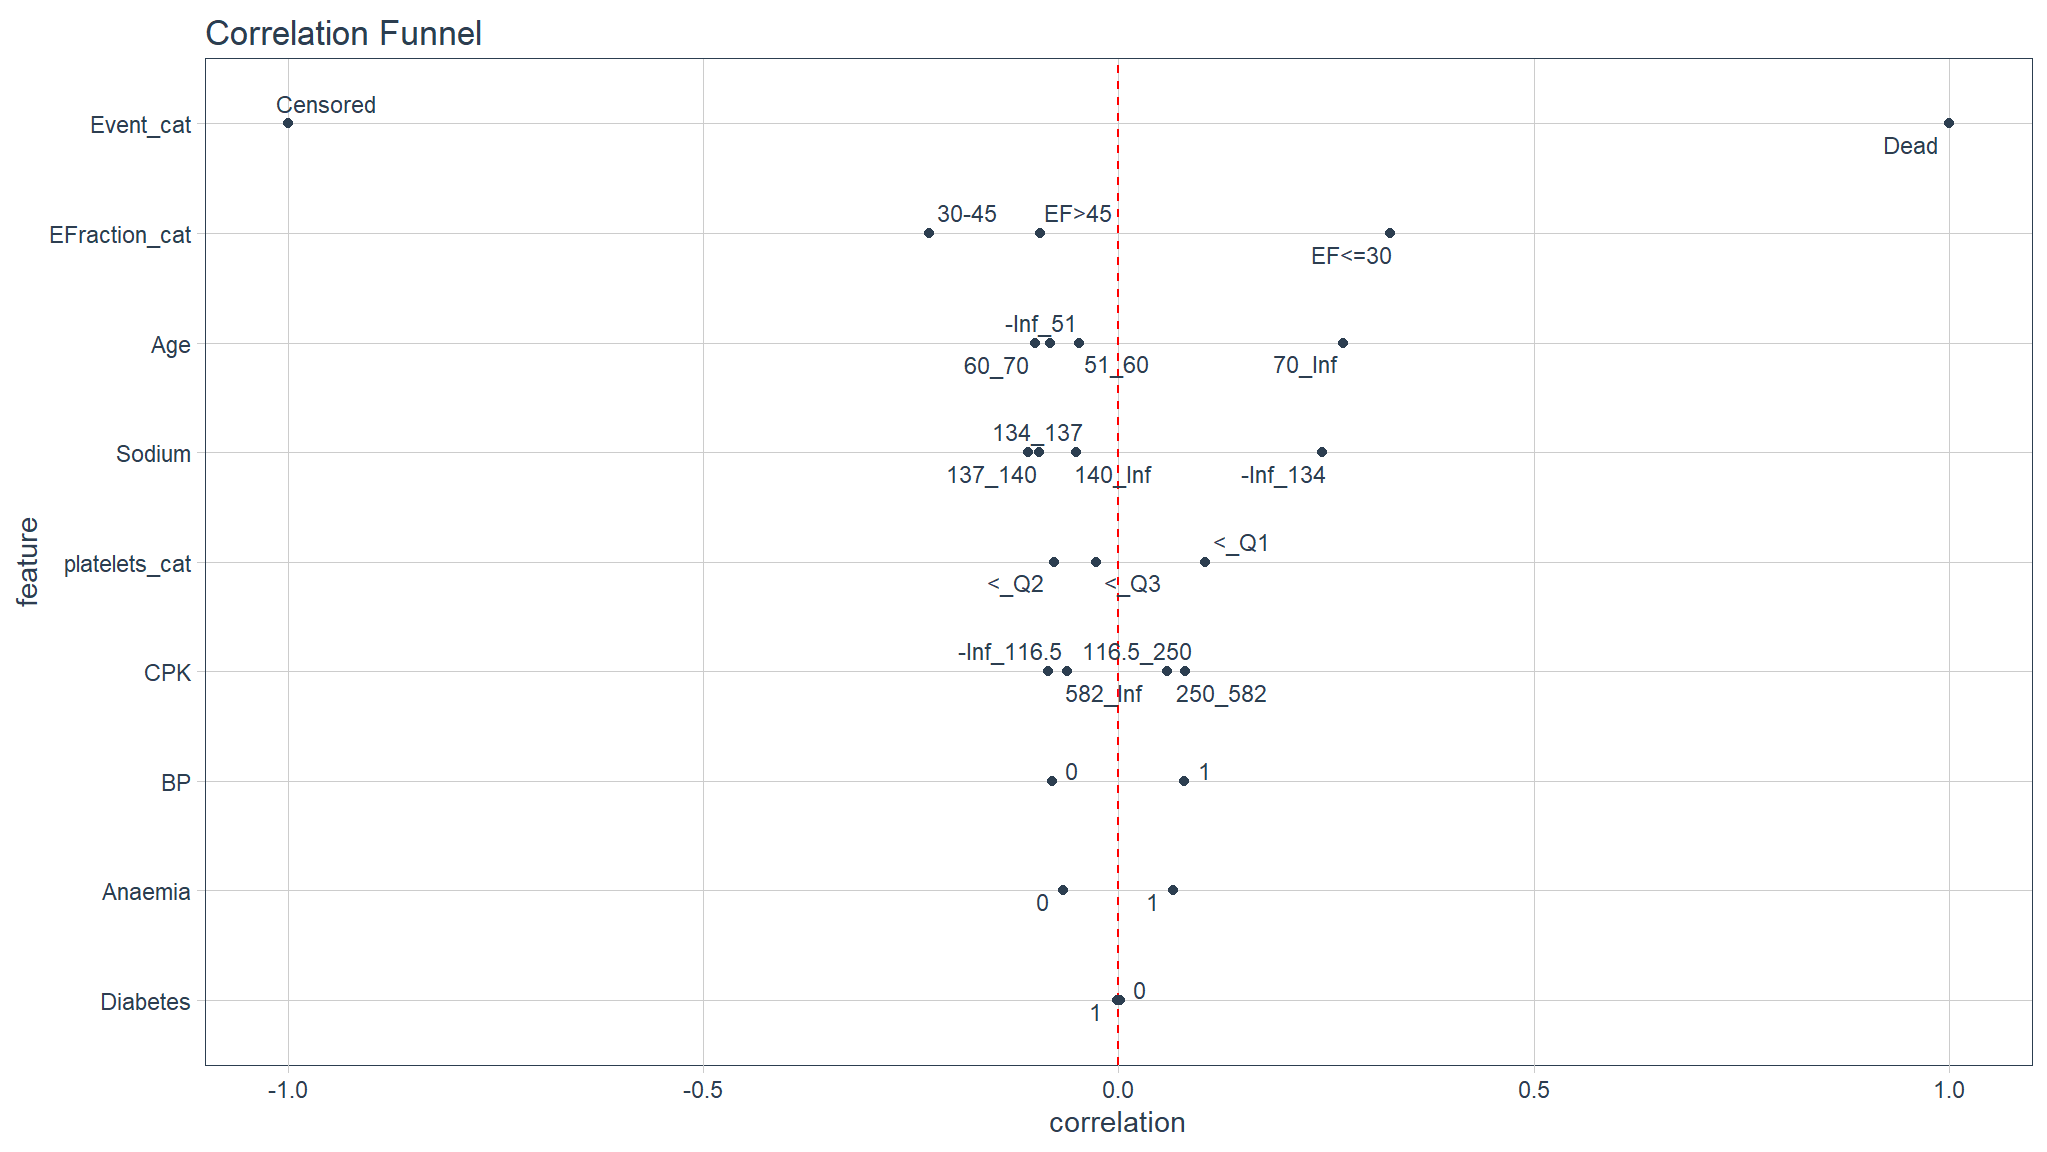
- The plot above shows the categories of patients who are at the risk of experiencing heart attack
- Patients who have an Ejection Fraction less than 30 (
*EF<=30*) have a higher risk of experiencing or dying from heart attack. - Patients aged 70 and above (
*70_inf*) also face a higher risk of dying from Heart attack - Patients whose platelets are below the lower quartile (
*<_Q1*) and have BP and anaemia have higher chances of dying from heart attack. - much is not clear about effect of diabetes , but it turns out not to be a major cause of death.
Statistical Modeling
Generalised linear models (Logistic Regression)
Univariate Model
| Characteristic | N | OR1 | 95% CI1 | p-value |
|---|---|---|---|---|
| platelets_cat | 299 | |||
| < Q1 | — | — | ||
| < Q2 | 0.58 | 0.32, 1.05 | 0.072 | |
| < Q3 | 0.68 | 0.38, 1.22 | 0.2 | |
| Gender | 299 | 0.98 | 0.59, 1.64 | >0.9 |
| Age | 299 | 1.05 | 1.03, 1.07 | <0.001 |
| EFraction_cat | 299 | |||
| 30-45 | — | — | ||
| EF<=30 | 4.50 | 2.57, 8.04 | <0.001 | |
| EF>45 | 1.13 | 0.54, 2.28 | 0.7 | |
| Smoking | 299 | 0.94 | 0.56, 1.58 | 0.8 |
| Sodium | 299 | 0.91 | 0.85, 0.96 | 0.001 |
| BP | 299 | 1.42 | 0.86, 2.34 | 0.2 |
| Diabetes | 299 | 0.99 | 0.60, 1.62 | >0.9 |
| Anaemia | 299 | 1.33 | 0.82, 2.17 | 0.3 |
| CPK | 299 | 1.00 | 1.00, 1.00 | 0.3 |
| 1 OR = Odds Ratio, CI = Confidence Interval | ||||
Multivariate Model
| Characteristic | OR1 | 95% CI1 | p-value |
|---|---|---|---|
| platelets_cat | |||
| < Q1 | — | — | |
| < Q2 | 0.44 | 0.21, 0.90 | 0.027 |
| < Q3 | 0.66 | 0.33, 1.31 | 0.2 |
| Gender | 0.68 | 0.34, 1.35 | 0.3 |
| Age | 1.07 | 1.04, 1.10 | <0.001 |
| EFraction_cat | |||
| 30-45 | — | — | |
| EF<=30 | 5.86 | 3.10, 11.5 | <0.001 |
| EF>45 | 1.06 | 0.47, 2.32 | 0.9 |
| Smoking | 1.02 | 0.52, 2.00 | >0.9 |
| Sodium | 0.91 | 0.85, 0.97 | 0.004 |
| BP | 1.41 | 0.79, 2.53 | 0.2 |
| Diabetes | 1.14 | 0.64, 2.06 | 0.7 |
| Anaemia | 1.23 | 0.68, 2.23 | 0.5 |
| CPK | 1.00 | 1.00, 1.00 | 0.013 |
| No. Obs. | 299 | ||
| Log-likelihood | -150 | ||
| AIC | 325 | ||
| BIC | 373 | ||
| 1 OR = Odds Ratio, CI = Confidence Interval | |||
For a unit increase in Age , the odds of dying increase by a significant percentage > Patients with Ejection Fraction below 30 have 6 times chances of dying from Heart attack as comprared to other groups.
A unit increase in sodium , decreases the odds of dying from Heart Attack
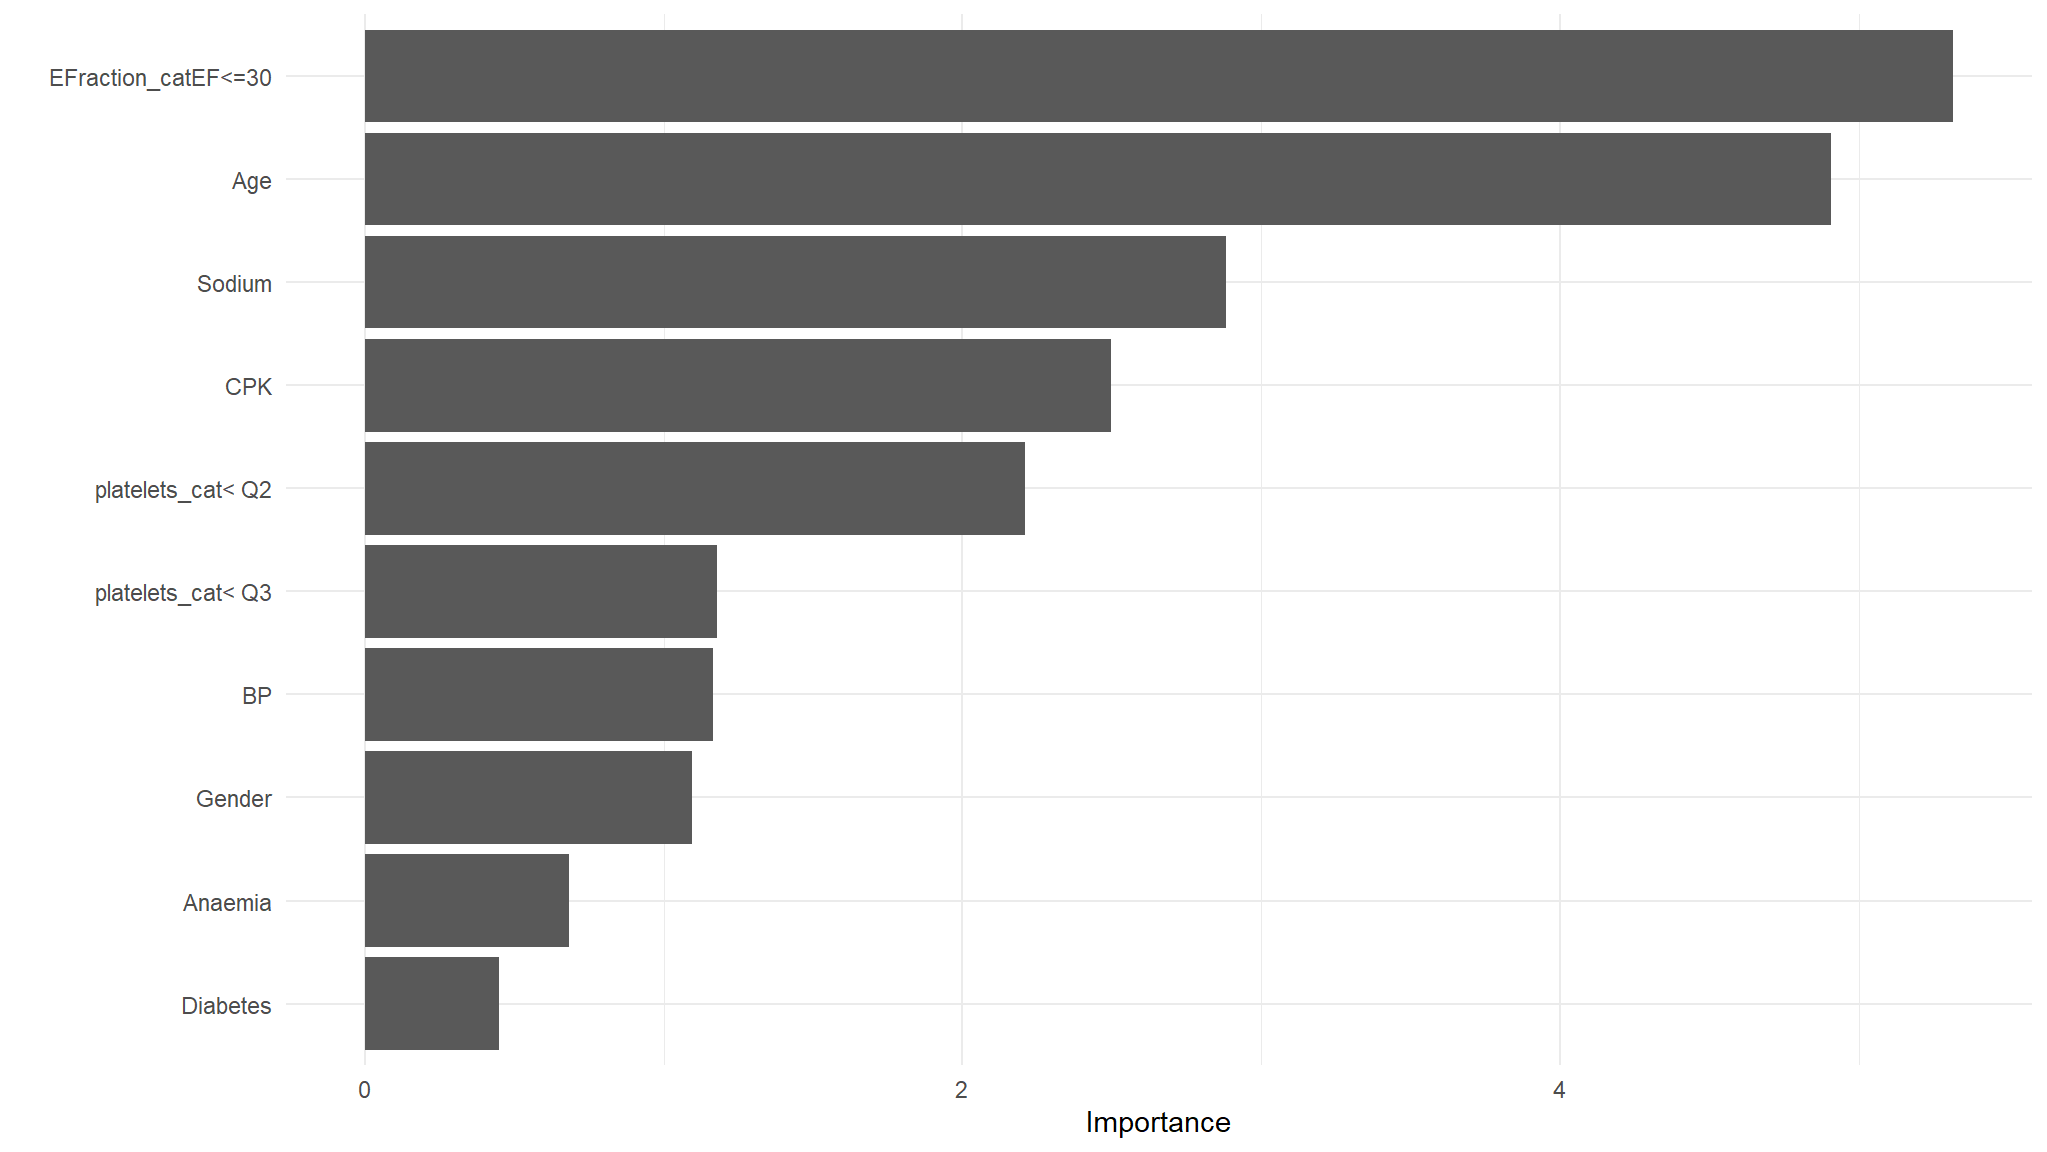
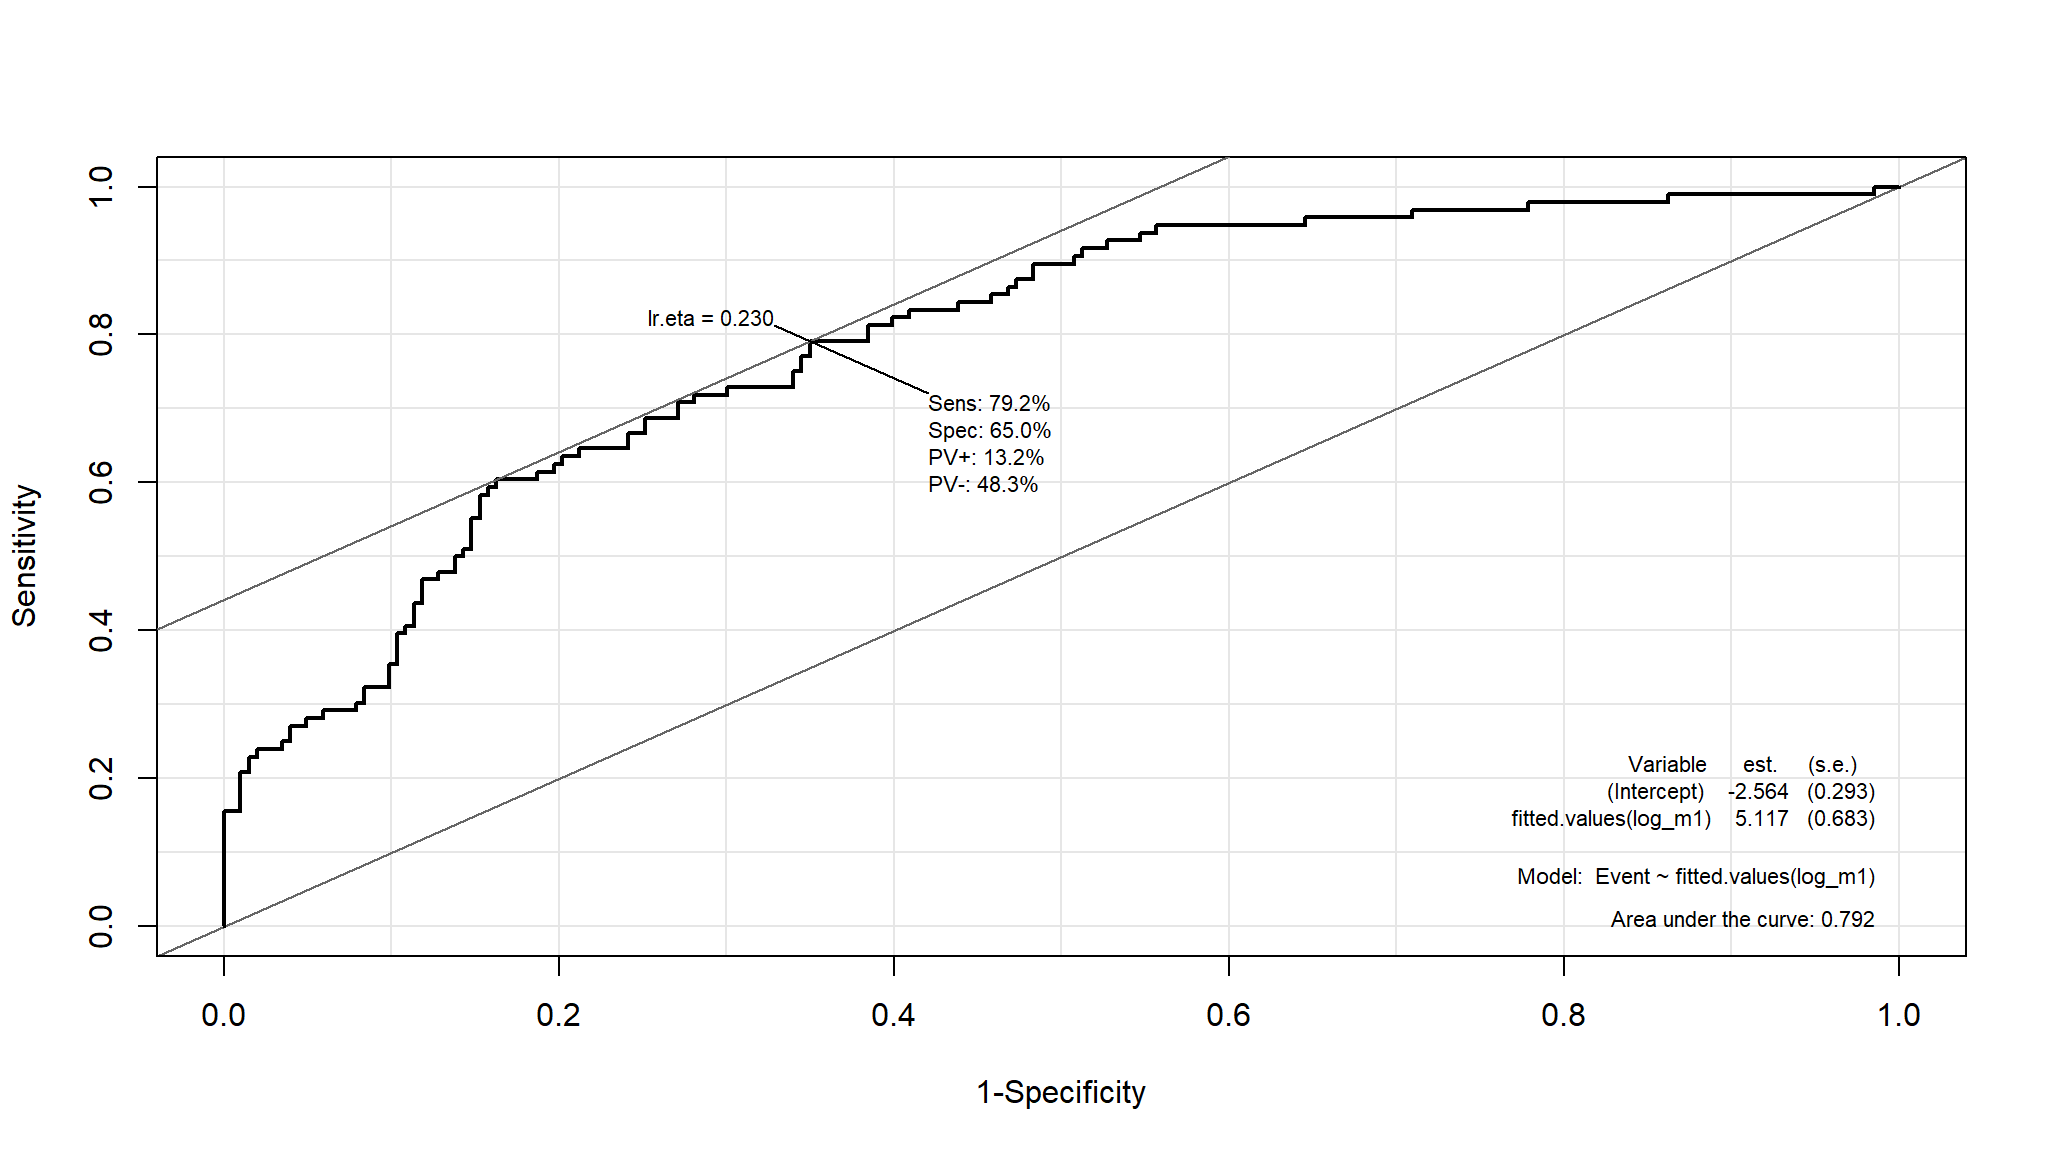
- The plot above shows variables that are most important in prediction of heart attack. Ejection Fraction , Age and Sodium are the top 3 most important predictors of heart attack.
#> # Indices of model performance
#>
#> AIC     |    AICc |     BIC | Tjur's R2 |  RMSE | Sigma | Log_loss | Score_log | Score_spherical |   PCP
#> --------------------------------------------------------------------------------------------------------
#> 325.141 | 326.419 | 373.247 |     0.238 | 0.408 | 1.000 |    0.500 |   -43.829 |           0.012 | 0.668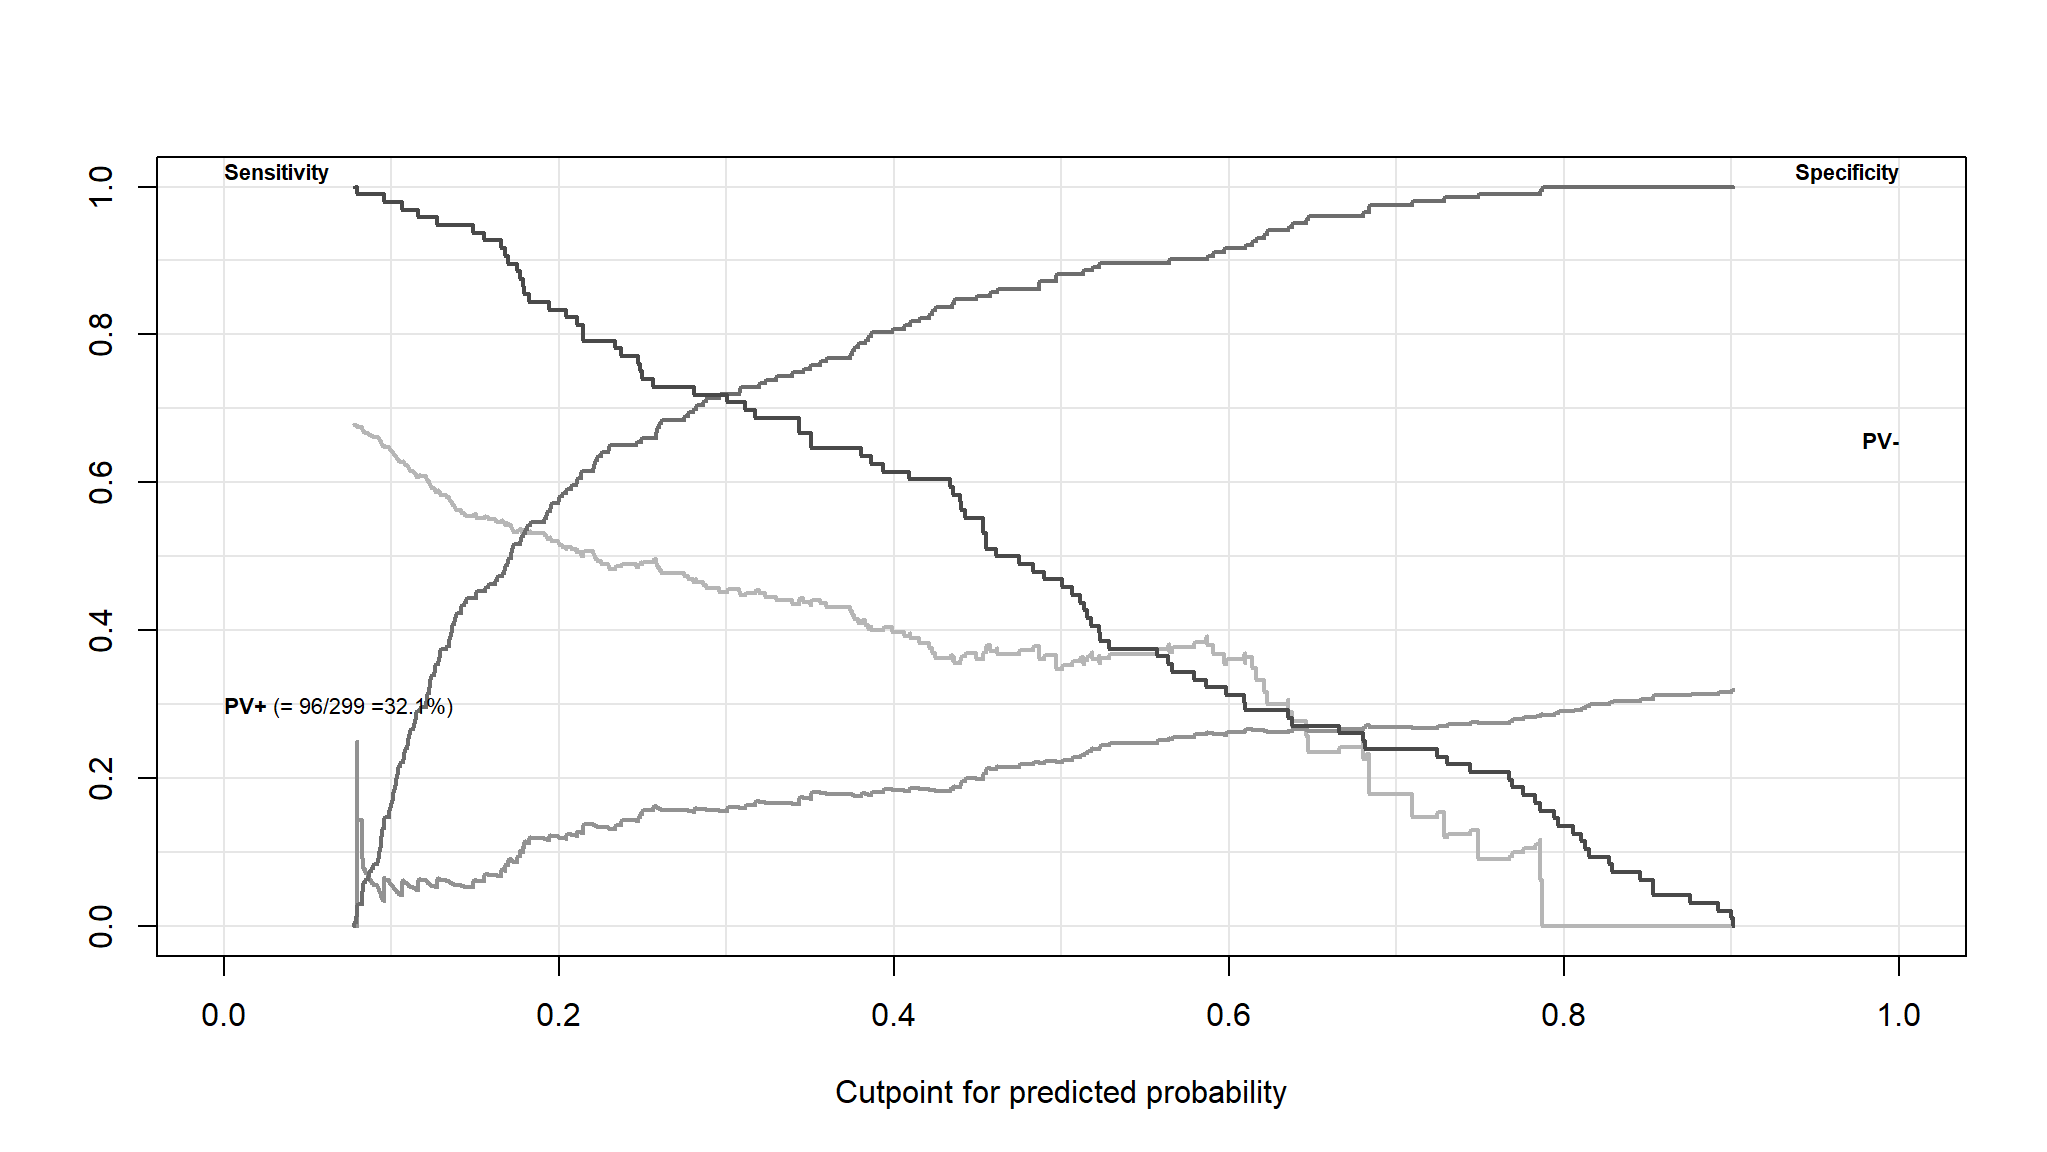
#> Call: survfit(formula = Surv(TIME, Event) ~ 1, data = out_new)
#>
#>  time n.risk n.event survival std.err lower 95% CI upper 95% CI
#>     4    299       1    0.997 0.00334        0.990        1.000
#>     6    298       1    0.993 0.00471        0.984        1.000
#>     7    297       2    0.987 0.00664        0.974        1.000
#>     8    295       2    0.980 0.00811        0.964        0.996
#>    10    293       6    0.960 0.01135        0.938        0.982
#>    11    287       2    0.953 0.01222        0.930        0.977
#>    13    284       1    0.950 0.01263        0.925        0.975
#>    14    283       2    0.943 0.01340        0.917        0.970
#>    15    281       2    0.936 0.01412        0.909        0.964
#>    20    278       2    0.930 0.01480        0.901        0.959
#>    23    275       2    0.923 0.01545        0.893        0.954
#>    24    273       1    0.920 0.01575        0.889        0.951
#>    26    272       3    0.909 0.01663        0.877        0.943
#>    27    269       1    0.906 0.01691        0.873        0.940
#>    28    268       2    0.899 0.01745        0.866        0.934
#>    29    266       1    0.896 0.01771        0.862        0.931
#>    30    264       4    0.882 0.01869        0.846        0.920
#>    31    259       1    0.879 0.01893        0.843        0.917
#>    32    258       1    0.875 0.01916        0.839        0.914
#>    33    257       2    0.869 0.01961        0.831        0.908
#>    35    254       1    0.865 0.01983        0.827        0.905
#>    38    253       1    0.862 0.02004        0.823        0.902
#>    40    252       1    0.858 0.02025        0.820        0.899
#>    41    251       1    0.855 0.02046        0.816        0.896
#>    42    250       1    0.852 0.02066        0.812        0.893
#>    43    249       3    0.841 0.02124        0.801        0.884
#>    44    246       1    0.838 0.02143        0.797        0.881
#>    45    245       1    0.834 0.02161        0.793        0.878
#>    50    244       1    0.831 0.02179        0.789        0.875
#>    55    241       1    0.828 0.02197        0.786        0.872
#>    59    240       1    0.824 0.02215        0.782        0.869
#>    60    239       2    0.817 0.02250        0.774        0.863
#>    61    236       1    0.814 0.02267        0.771        0.859
#>    64    234       1    0.810 0.02283        0.767        0.856
#>    65    233       2    0.803 0.02316        0.759        0.850
#>    66    231       1    0.800 0.02332        0.755        0.847
#>    67    230       1    0.796 0.02348        0.752        0.844
#>    72    227       1    0.793 0.02364        0.748        0.841
#>    73    225       2    0.786 0.02394        0.740        0.834
#>    77    217       1    0.782 0.02411        0.736        0.831
#>    78    216       1    0.779 0.02427        0.732        0.828
#>    82    207       1    0.775 0.02444        0.728        0.824
#>    88    194       1    0.771 0.02464        0.724        0.821
#>    90    189       2    0.763 0.02504        0.715        0.813
#>    95    180       1    0.758 0.02526        0.711        0.810
#>    96    175       1    0.754 0.02548        0.706        0.806
#>   100    173       1    0.750 0.02571        0.701        0.802
#>   109    159       1    0.745 0.02597        0.696        0.798
#>   111    155       1    0.740 0.02625        0.691        0.794
#>   113    152       1    0.735 0.02652        0.685        0.789
#>   115    150       1    0.730 0.02679        0.680        0.785
#>   126    136       1    0.725 0.02713        0.674        0.780
#>   129    135       1    0.720 0.02746        0.668        0.776
#>   130    134       1    0.714 0.02777        0.662        0.771
#>   135    132       1    0.709 0.02808        0.656        0.766
#>   150    118       1    0.703 0.02848        0.649        0.761
#>   154    117       1    0.697 0.02886        0.643        0.756
#>   162    116       1    0.691 0.02923        0.636        0.751
#>   170    115       1    0.685 0.02959        0.629        0.745
#>   171    114       1    0.679 0.02993        0.623        0.740
#>   172    113       2    0.667 0.03059        0.610        0.730
#>   180    106       2    0.654 0.03128        0.596        0.719
#>   193     86       1    0.647 0.03183        0.587        0.712
#>   196     83       1    0.639 0.03238        0.578        0.706
#>   198     79       1    0.631 0.03297        0.569        0.699
#>   207     71       1    0.622 0.03368        0.559        0.692
#>   214     53       1    0.610 0.03503        0.545        0.683
#>   235     37       1    0.594 0.03776        0.524        0.673
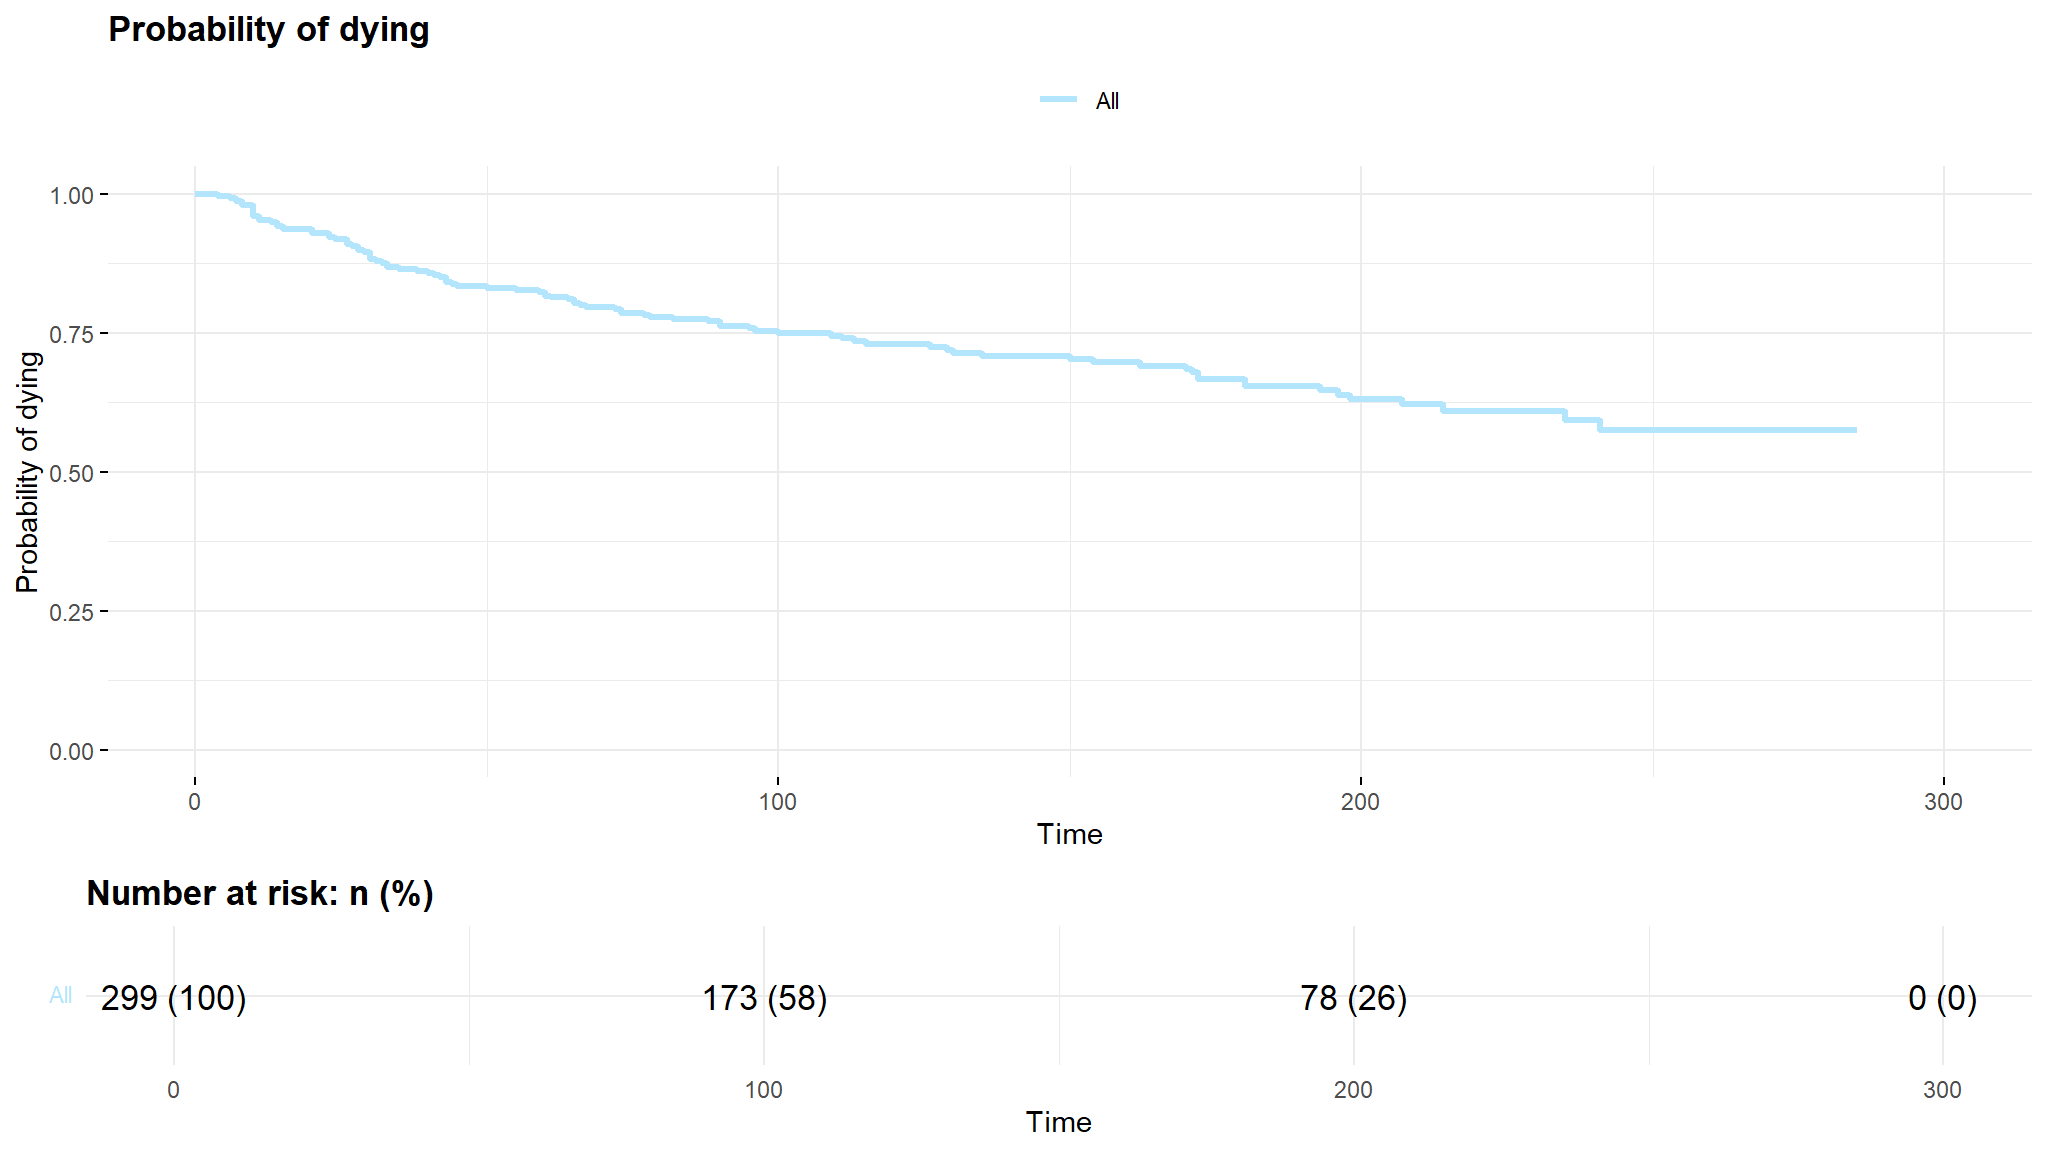
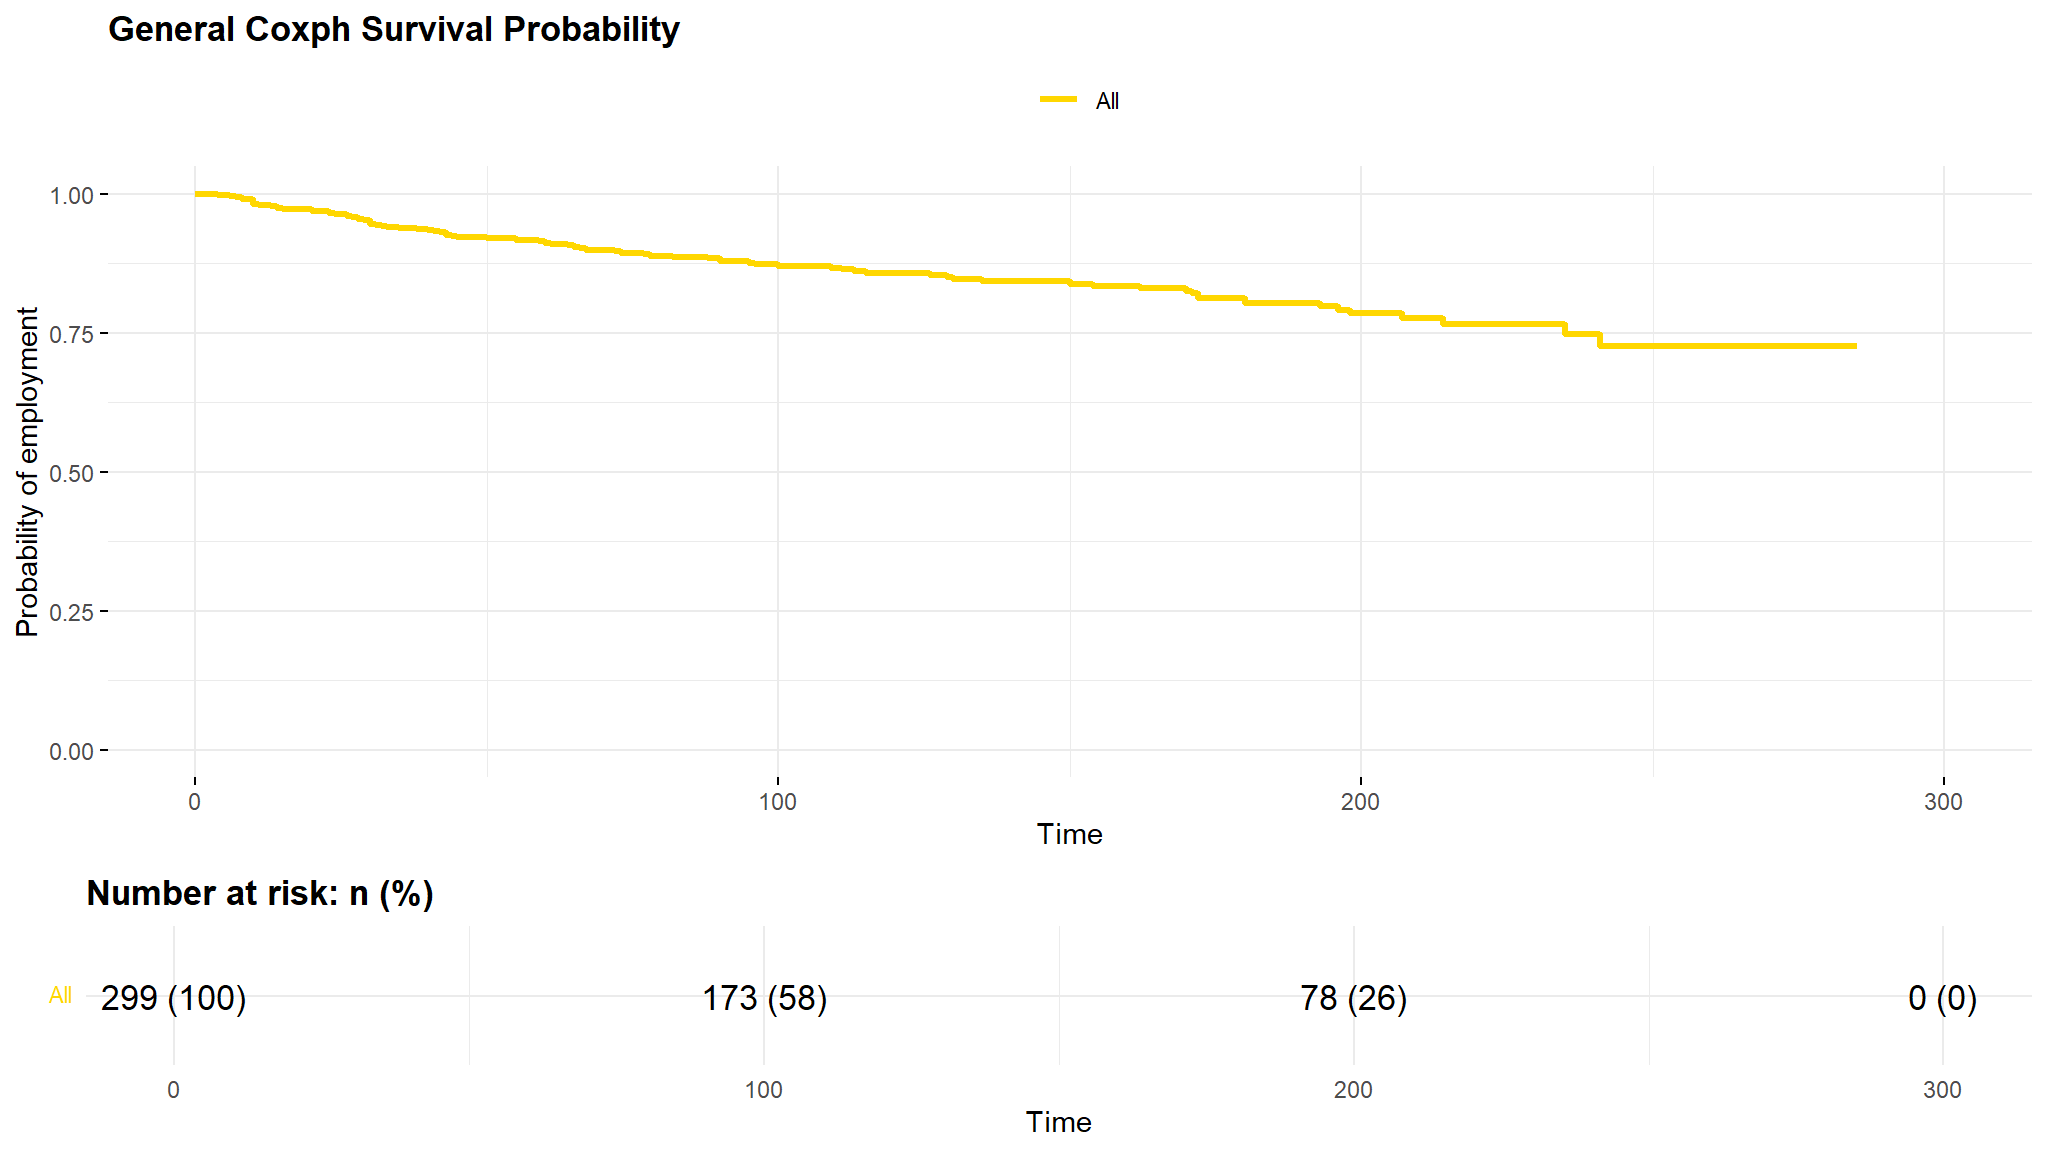
#> 241 33 1 0.576 0.04068 0.501 0.661- looking at the survival curve ,note that it always starts at 1 and goes down in time
Summary by Gender
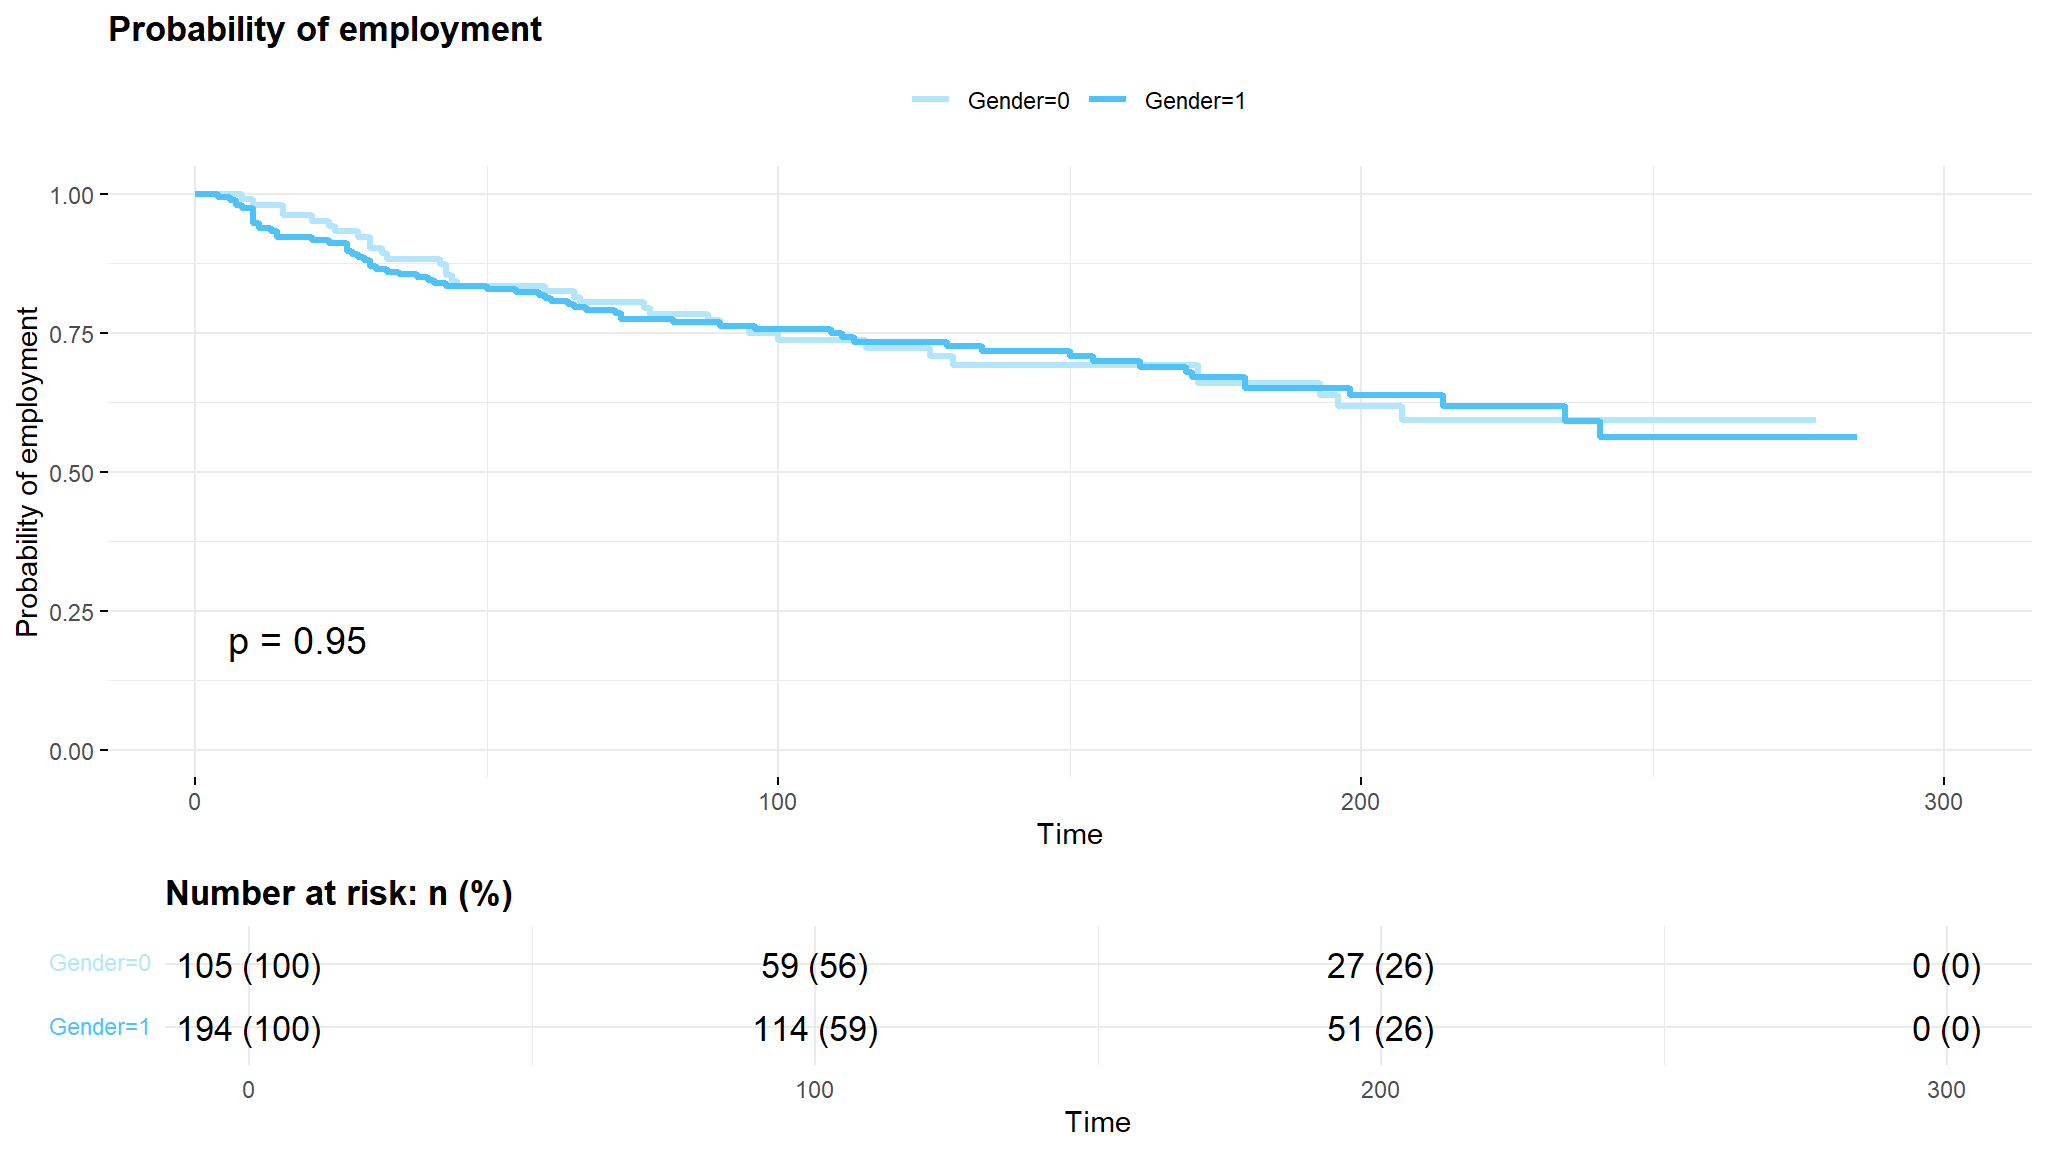
- there are minor differences in the survival times (
time to death) between males and females
Summary by Ejection Fraction
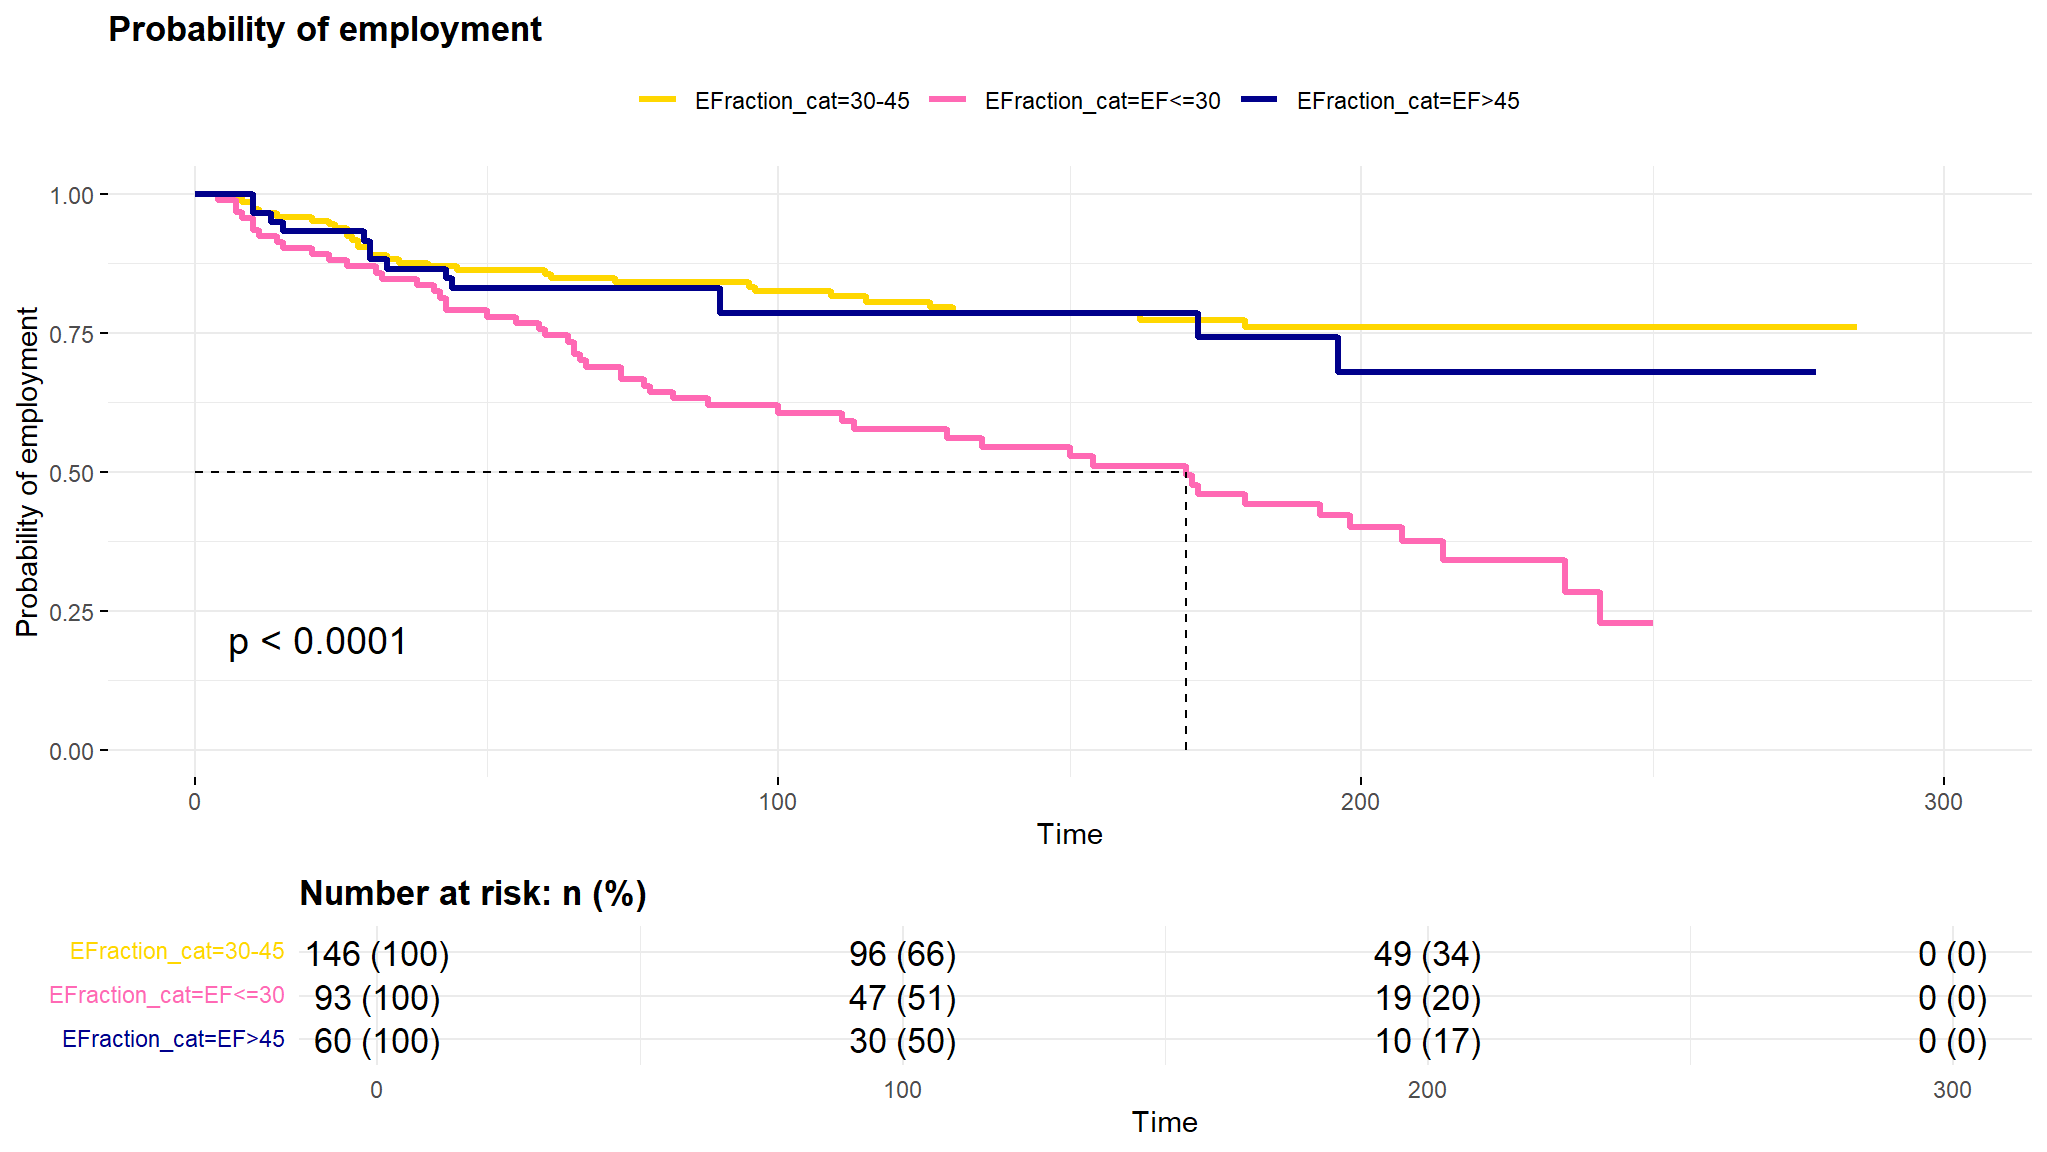
- Patients with Ejection Fraction less than 30 experience death faster as compared to the other 2 groups.
- it can be noted from the log rank that the
survival timesbetween these groups is significantly different
Summary by Platelets
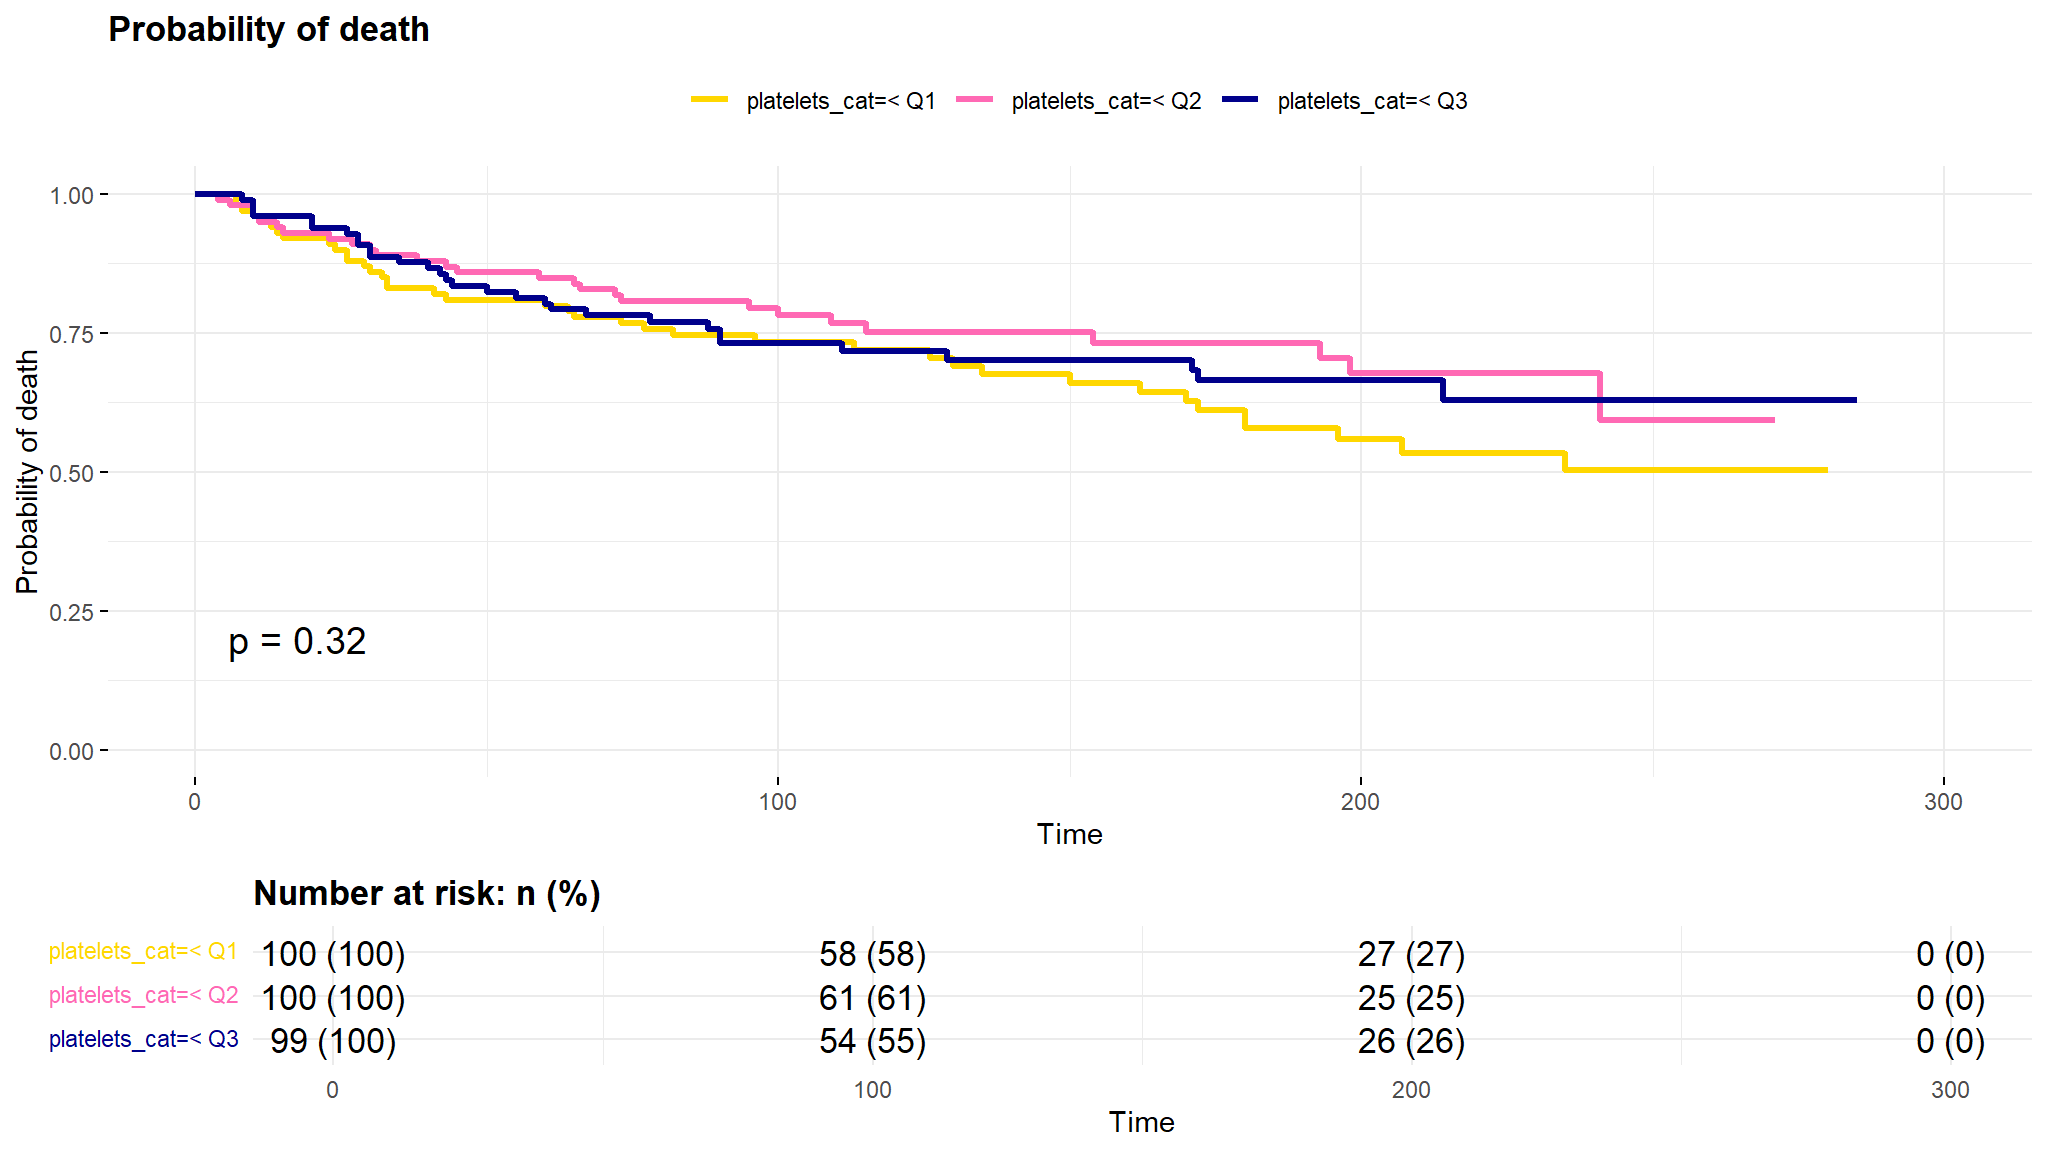
- we notice a small difference in these curves starting
- The difference is not statistically different
Cox proportional Hazard
| Characteristic | HR1 | 95% CI1 | p-value |
|---|---|---|---|
| platelets_cat | 0.2 | ||
| < Q1 | — | — | |
| < Q2 | 0.64 | 0.38, 1.08 | |
| < Q3 | 0.78 | 0.47, 1.29 | |
| Gender | 0.77 | 0.48, 1.26 | 0.3 |
| Age | 1.05 | 1.03, 1.07 | <0.001 |
| EFraction_cat | <0.001 | ||
| 30-45 | — | — | |
| EF<=30 | 3.46 | 2.16, 5.55 | |
| EF>45 | 1.22 | 0.64, 2.33 | |
| Smoking | 1.09 | 0.67, 1.77 | 0.7 |
| Sodium | 0.93 | 0.89, 0.97 | 0.002 |
| BP | 1.73 | 1.13, 2.66 | 0.013 |
| Diabetes | 1.08 | 0.70, 1.65 | 0.7 |
| Anaemia | 1.33 | 0.86, 2.06 | 0.2 |
| CPK | 1.00 | 1.00, 1.00 | 0.018 |
| No. Obs. | 299 | ||
| Log-likelihood | -470 | ||
| AIC | 964 | ||
| BIC | 995 | ||
| 1 HR = Hazard Ratio, CI = Confidence Interval | |||
- holding all other covariates constant ,increase in Age increases the
hazard of death by 5% - an decrease in Ejection Fraction increases the hazard of death by 4 folds , we see this because the hazard of death is four fold for patients with Ejection Fraction less than 30.
Visualise the results
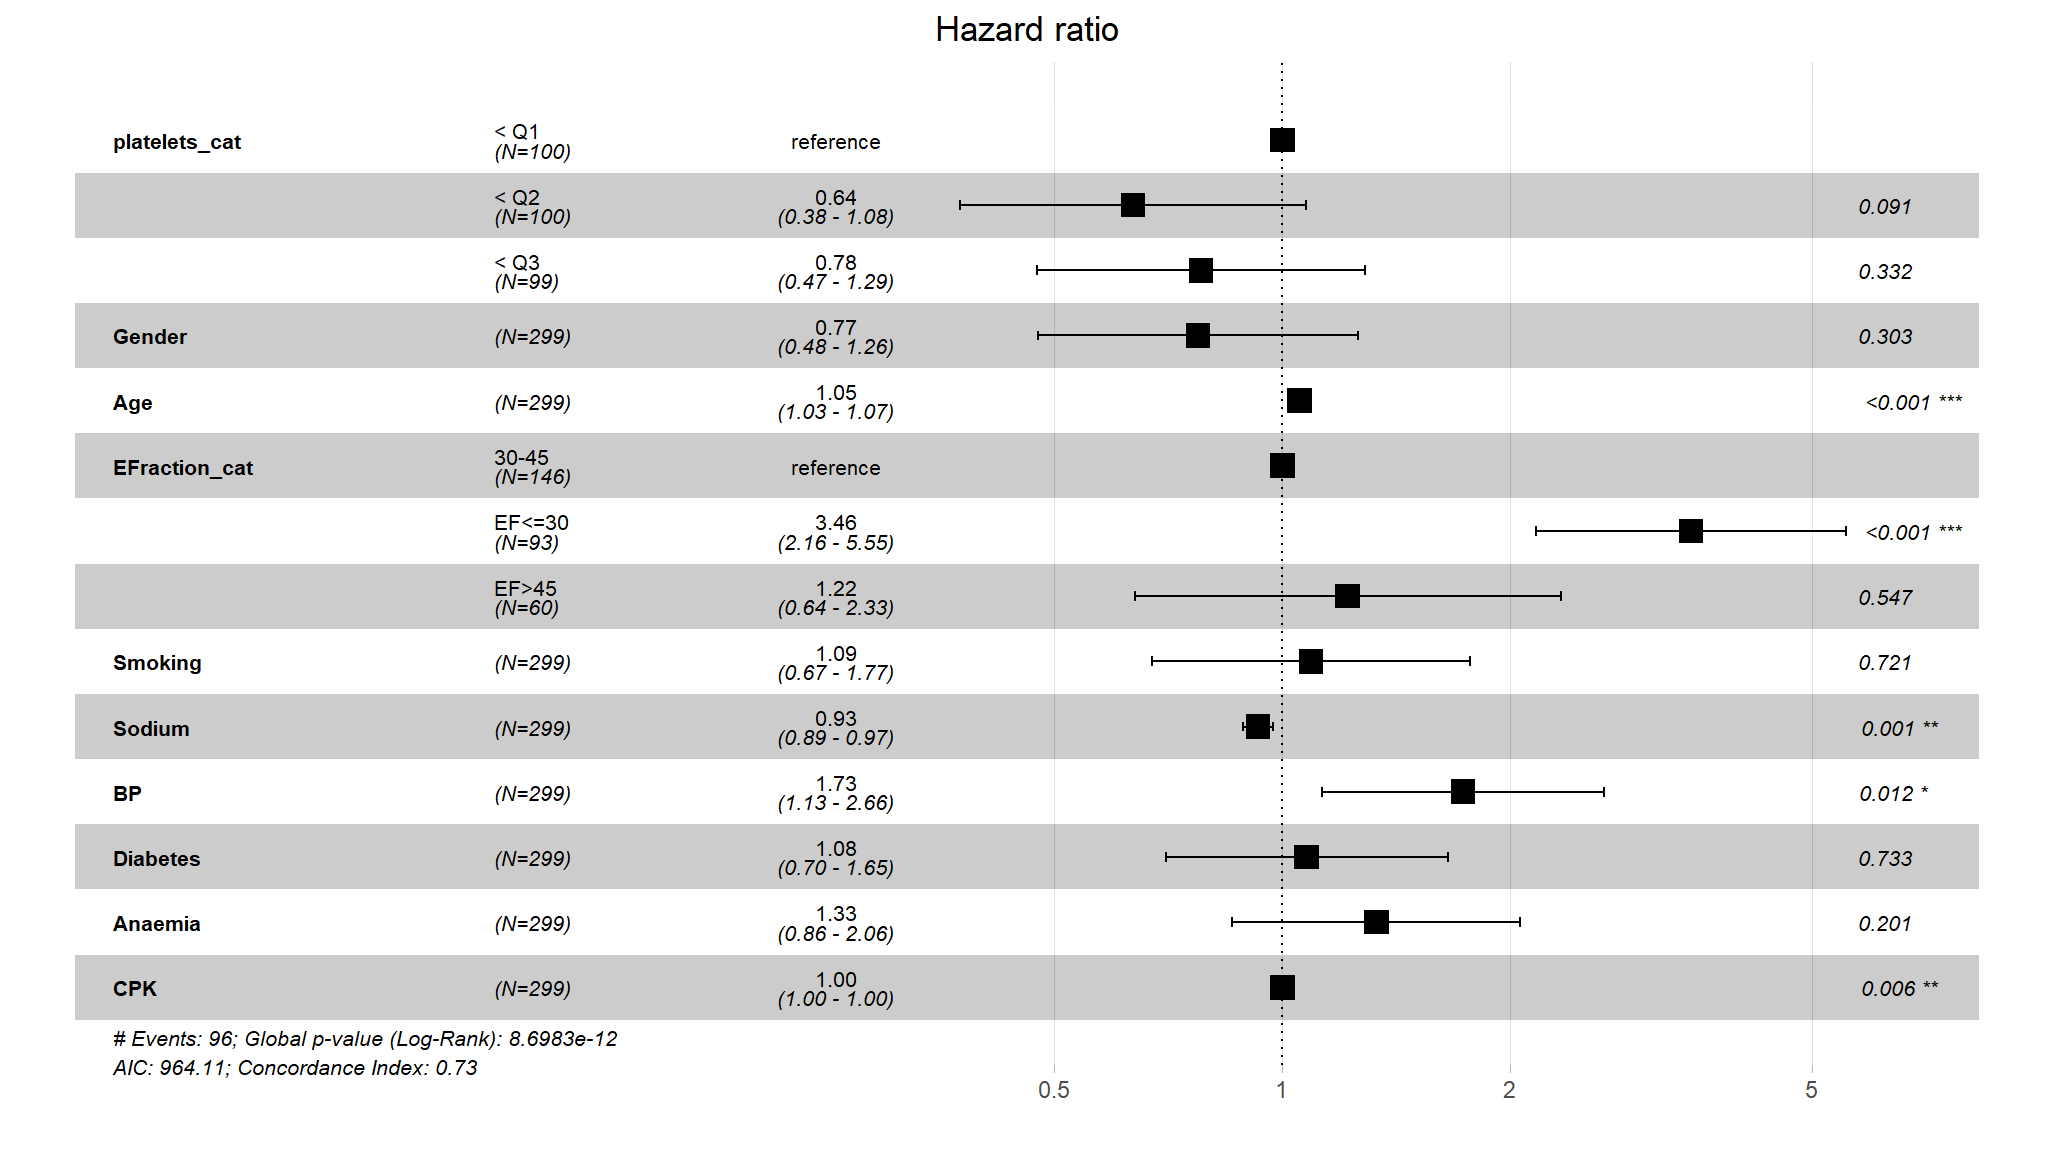
- Age and Ejection Fraction are significant predictors of death
- the
higher Age groupshave a higher probability of dying from heart attack - The statistical analysis identified age, EF, creatinine, sodium, anemia and BP as the significant variables affecting the likelihood of mortality among heart failure patients.
It can be concluded that growing age, renal dysfunction (having serum creatinine greater than its normal level 1.5), high BP (higher than normal range), higher level of anaemia and lower values of ejection fraction (EF) are the key factors contributing towards increased risk of mortality among heart failure patients. Increased level of serum sodium can reduce the odds of death. No significant differences were found due to smoking status, diabetes and gender of patients.