# A tibble: 4 × 5
  Name                     sex     age height weight
  <chr>                    <chr> <dbl>  <dbl>  <dbl>
1 A Dijiang                M        24    180     80
2 A Lamusi                 M        23    170     60
3 Christine Jacoba Aaftink F        21    185     82
4 Per Knut Aaland M 31 188 75Common Operations In Data Analytics
Comparing R ,SQL ,Powerbi and EXCEL
Rstudio
Powerbi
Excel
R
Today’s data
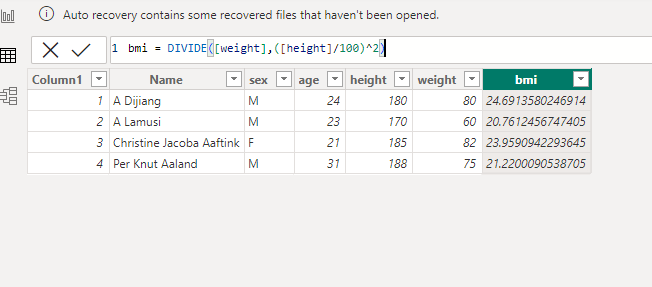
\[BMI = \frac{weight (KG)} {(Height (m))^2}\]
- Choose the cell for the resulting output. You can use the mouse to select the cell or use the arrow key to navigate.
- Type “=” in the cell. The equal sign will appear in the cell and formula bar.
- Type the address of the cell that we want to use for our calculation. In our case, it is E2 (weight/KG).
- Add divide sign “/”
- To convert height from centimeters to a meter, we will divide the D2 by 100.
- Take the squared “^2” of the height and press Enter.
knitr::include_graphics("Adding_Excel_formula.gif")
df |>
  mutate(bmi = weight /(height/100)^2)
# A tibble: 4 × 6
Name sex age height weight bmi
<chr> <chr> <dbl> <dbl> <dbl> <dbl>
1 A Dijiang M 24 180 80 24.7
2 A Lamusi M 23 170 60 20.8
3 Christine Jacoba Aaftink F 21 185 82 24.0
4 Per Knut Aaland M 31 188 75 21.2SELECT *, weight /POWER((height/100),2) AS bmi FROM df;| Name | sex | age | height | weight | bmi |
|---|---|---|---|---|---|
| A Dijiang | M | 24 | 180 | 80 | 24.69136 |
| A Lamusi | M | 23 | 170 | 60 | 20.76125 |
| Christine Jacoba Aaftink | F | 21 | 185 | 82 | 23.95909 |
| Per Knut Aaland | M | 31 | 188 | 75 | 21.22001 |
1. SUM
The SUM() formula performs addition on selected cells. It works on cells containing numerical values and requires two or more cells.
In our case, we will be applying the SUM formula to a range of cells from C2 to C5 and storing the result on C6. It will add 24, 23, 21, and 31. You can also apply this formula to multiple columns.
=SUM(C2:C5)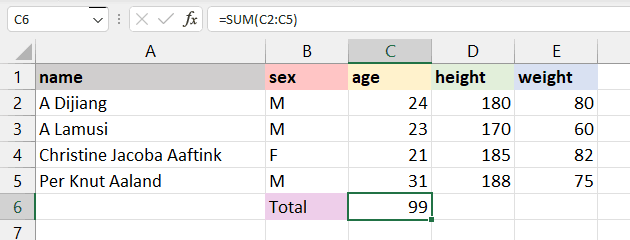
(Total<-sum(df$age))[1] 99SELECT SUM(age) AS Total FROM df;| Total |
|---|
| 99 |
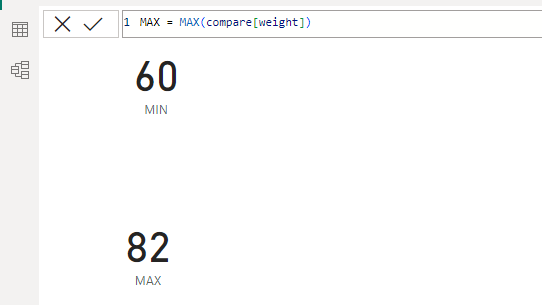
Total = SUM(compare[age])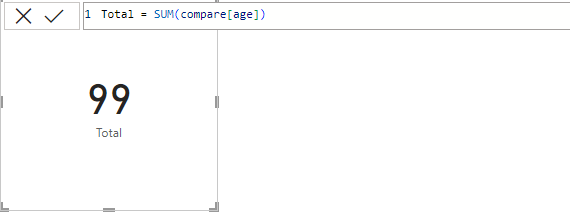
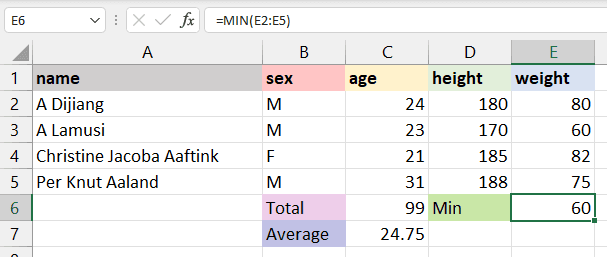
MIN and MAX
The MIN() formula requires a range of cells, and it returns the minimum value. For example, we want to display the minimum weight among all athletes on the E6 cell. The MIN formula will search for the minimum value and show 60.
Concatenate
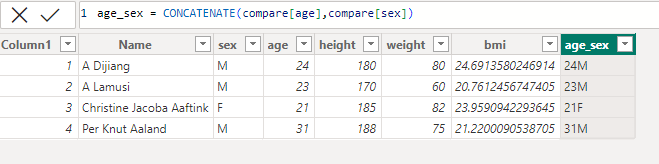
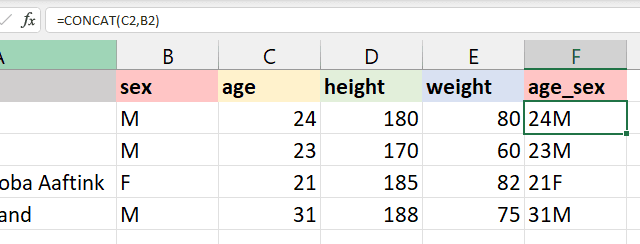
SELECT *, CONCAT(age,'',sex) AS age_sex FROM df;| Name | sex | age | height | weight | age_sex |
|---|---|---|---|---|---|
| A Dijiang | M | 24 | 180 | 80 | 24.0M |
| A Lamusi | M | 23 | 170 | 60 | 23.0M |
| Christine Jacoba Aaftink | F | 21 | 185 | 82 | 21.0F |
| Per Knut Aaland | M | 31 | 188 | 75 | 31.0M |
df |>
  mutate(age_sex = paste0(age,"",sex))
# A tibble: 4 × 6
Name sex age height weight age_sex
<chr> <chr> <dbl> <dbl> <dbl> <chr>
1 A Dijiang M 24 180 80 24M
2 A Lamusi M 23 170 60 23M
3 Christine Jacoba Aaftink F 21 185 82 21F
4 Per Knut Aaland M 31 188 75 31M jOINING TABLES
df# A tibble: 4 × 5
Name sex age height weight
<chr> <chr> <dbl> <dbl> <dbl>
1 A Dijiang M 24 180 80
2 A Lamusi M 23 170 60
3 Christine Jacoba Aaftink F 21 185 82
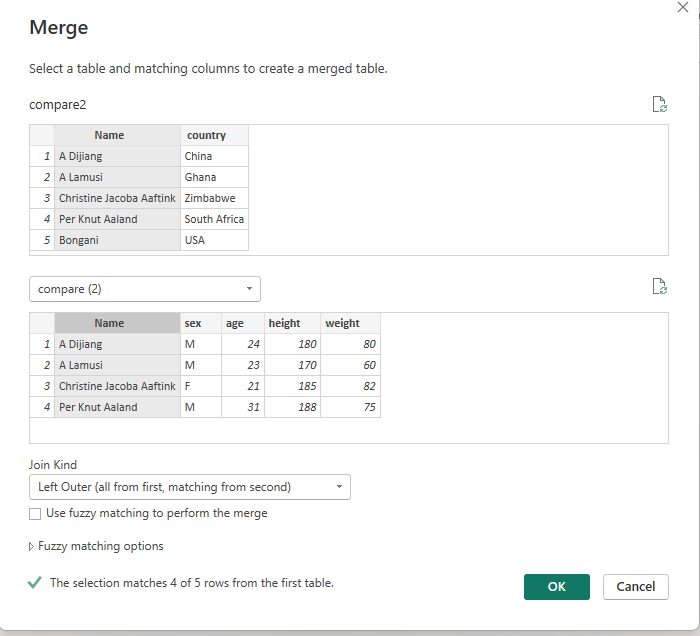
4 Per Knut Aaland M 31 188 75df2# A tibble: 5 × 2
Name country
<chr> <chr>
1 A Dijiang China
2 A Lamusi Ghana
3 Christine Jacoba Aaftink Zimbabwe
4 Per Knut Aaland South Africa
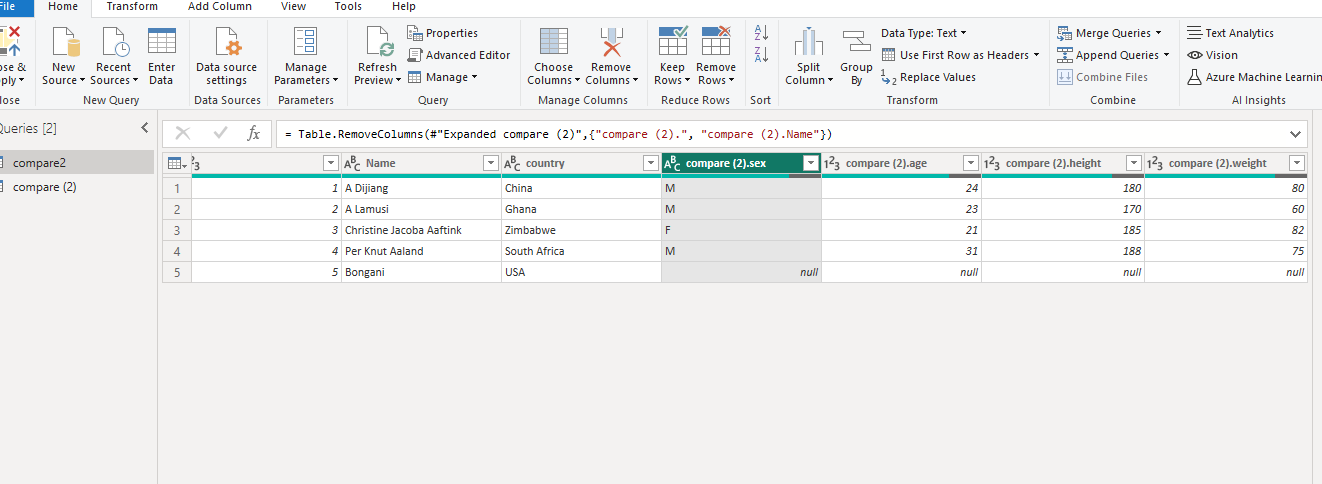
5 Bongani USA df |>
left_join(df2,by="Name")# A tibble: 4 × 6
Name sex age height weight country
<chr> <chr> <dbl> <dbl> <dbl> <chr>
1 A Dijiang M 24 180 80 China
2 A Lamusi M 23 170 60 Ghana
3 Christine Jacoba Aaftink F 21 185 82 Zimbabwe
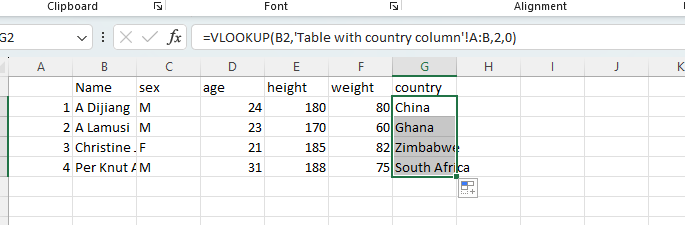
4 Per Knut Aaland M 31 188 75 South AfricaSELECT d1.Name,d1.sex,d1.age,d1.height,d1.weight,d2.country
FROM df AS d1
LEFT JOIN df2 AS d2
ON d1.Name = d2.Name;| Name | sex | age | height | weight | country |
|---|---|---|---|---|---|
| A Dijiang | M | 24 | 180 | 80 | China |
| A Lamusi | M | 23 | 170 | 60 | Ghana |
| Christine Jacoba Aaftink | F | 21 | 185 | 82 | Zimbabwe |
| Per Knut Aaland | M | 31 | 188 | 75 | South Africa |